College of Agriculture and Natural Resources
Center for Land Use Education and Research

 |
 |
| Examples of land cover map (top) and forest fragmentation map (below). |
Land cover, as its name implies, shows the "covering" of the landscape. This is to be distinguished from land use, which is what is permitted, practiced or intended for a given area. For example, a "forested" land cover area as detected by the satellite may appear as "rural residential" on your town's zoning map. CLEAR's land cover information comes from remotely sensed data from satellites, in this case several of the Landsat satellite series. Sensors aboard the satellite collect (sense) radiation in a number of different wavelengths that is reflected from the surface of the earth. The data are converted via computer programs and human expertise into land cover maps made up of many pieces, or pixels, of information that are 30 meters (or about 100 feet) square. Although remotely sensed land cover maps have been around for quite some time, comparing different land cover datasets has been difficult. Satellite sensors are continually evolving along with the land cover information derived from them. Land cover derived from images from different years taken by different sensors (and perhaps at different times of the year) normally cannot be compared directly with any claim of accuracy. CLEAR's challenge was to solve this "apples and oranges" problem by using a technique called "cross-correlation analysis." This allows us to provide state citizens and decision makers with reliable, comparable information which shows how Connecticut's landscape has changed over the last 21 years. Maps from five dates (1985, 1990, 1995, 2002 and 2006) were created, and can be explored in various ways from the Statewide Data page of this site. The information is available at a more detailed level for each of the 169 individual municipalities in Connecticut, as well as for watersheds.
The FGDC (Federal Geographic Data Committee) has a standard form for reporting metadata, or information about data. Visit the FGDC-compliant metadata for:
Q. What is the Connecticut Land Cover Map Series?
A. The Connecticut Land Cover Map Series (Version 2) consists of five dates of land cover data (1985, 1990, 1995, 2002 and 2006) created from satellite imagery. Each dataset includes twelve consistently interpreted land cover categories. The data were produced in a way to insure easy comparison, especially for land cover change studies. The land cover data are available in digital format for use in Geographic Information Systems and can be used to produce a wide variety of map products.
Q. Can I mix and match Version 1 and Version 2 land cover?
A. No! Each series was created to be used together. Every date of the Version 1 series is different from every date of the Version 2 series.
Q. How does the Agricultural Field class compare to other estimates of Agricultural areas, such as the NRI?
A. Our Agricultural Field category includes areas that are under agricultural uses such as crop production and/or active pasture. It is also likely to include some abandoned agricultural areas that have not undergone conversion to woody vegetation. The USDA NRCS “Natural Resources Inventory” is similar, in that is based on Landat imagery, but since the NRI is a national survey it is created by statistical sampling, with a larger likelihood of error than CLEAR’s processing of each and every pixel. CCLV2 and NRI data are nonetheless fairly compatible, if you make allowances for differences in how the major land cover categories are defined. The USDA Agricultural Census data is collected via field office reports, mostly gathered via survey of farmers, and thus is not comparable to our research methods. Also, these data include all land included on farmsteads, not only agricultural fields but also forest, developed lands, and other land uses; thus it predictably quotes larger acreage statistics for comparable time periods.
Q. How is the Land Cover Map Series different from the previously created 1990 and 1995 land use land cover data?
A. The previously developed 1990 and 1995 land use land cover data also were created at the University of Connecticut from Landsat satellite imagery (the 1995 data also incorporated SPOT imagery - a French satellite). However, the purpose of these earlier versions primarily was for modeling nutrient inputs to Long Island Sound. For both datasets efforts were made, with mixed success, to infer land use (e. g. rural residential, commercial, industrial, etc.). The 1990 land use land cover dataset, which used 25 land use land cover classes, was the first statewide land use land cover dataset created by UConn researchers. Improved technologies and a different approach were used to create the 1995 land use land cover data and the classification was expanded to 28 categories. These earlier land use land cover data are very different from the new Land Cover Map Series and should not be compared to the new data.
Q. How can I view the land cover maps?
A. Beyond viewing static maps on the Statewide page and Your Town and Your Watershed pages, there are three ways on the web site to view the actual maps:
Each way has different features outlined in the table below. Click the title to jump to a choice.
PDFs |
|||
Software Required |
Adobe Reader* |
Web Browser (internet explorer, firefox, etc.) |
GIS Software |
GIS Expertise Required |
None |
None |
Some |
Allows for Zooming |
To some degree |
Yes |
Yes, in GIS software after download |
Allows for Printing |
Yes, although format is for 8.5 x 11 paper |
Yes, prints the view allowing for smaller geographic regions |
Yes, within GIS software |
Data can be viewed with your own GIS data |
No |
If you connect to the service using a GIS |
Yes |
Geographic Coordinates maintained |
No |
Yes |
Yes |
Ability to turn on/off and compare maps |
No. Multiple pdfs can be opened in different browsers, but not easily compared |
Yes |
Yes in a GIS |
* Adobe reader can be downloaded for free at http://www.adobe.com/products/acrobat/readstep2.html.
Q. Two change maps? I'm confused. What are the two change maps showing?
The purpose of these maps is to show areas that went from one of our “undeveloped” land cover classes (Other Grasses, Agricultural Field, Deciduous Forest, Coniferous Forest, Non-forested wetland, Tidal Wetland, etc.) to the “developed footprint” classes of Developed or Turf/Grass. Turf and grass is included because, most of the time, it is closely associated with development.
In the Your Town and Your Watershed section, we make available two types of change maps. Both maps show the same areas, as defined above, that have changed from undeveloped to developed during the 1985 – 2006 period. However,the different color schemes of the two maps show slightly different aspects of this new development.
 In the case of the Change to Developed Map, the color scheme is based on which of our four study time periods the land cover change occurred. Thus, changes occurring from 1985 – 1990 are colored orange, 1990 to 1995 changes are in pink, and so on). This allows the viewer to get a feel for the phasing of new development over time.
In the case of the Change From Map, the color scheme is based on what land cover class has been converted into these developed areas. Thus, green areas were formerly forest, brown areas agricultural fields, etc. This allows the viewer to get a feel for which type of undeveloped areas were converted, and how much.
A more detailed description of the categories of both change maps can be found in the About the Project section.
Q. How do you calculate change?
A. In this kind of research, there are three ways to measure change as described in the table below. The percent change reported in the data tables the Your Town and Your Basin page is the Relative rate of change. This means that if there is a small area to begin with (little area in time 1, or 1985), then the relative rate is likely to be high (or high percentage). If there is a large area to being with (lots of area in time 1, or 1985), then the relative rate is likely to be low (a small percentage).
T stands for a time period, so T1 would be an earlier date than T2. In most data tables on this website, T1 is 1985 and T2 is 2006.
Measure of land cover change |
Unit |
Calculation |
Significance |
Absolute change |
area, such as acres |
(acres T2 – acres T1) |
Allows aggregation of total areal change across the same geographic areas (such as towns or basins) |
Relative change |
percent |
(% area T2 - % area T1) |
Allows comparison between areas (such as towns or basin); relates to land cover indicators |
Relative rate of change |
percent |
(area T2 - area T1) / area T1 |
Gives feel for how quickly land cover is changing relative to 1985 baseline, within and between the same geographic area |
Q. Why can't I see my house on the land cover maps?
A. The land cover maps were produced by interpreting Landsat satellite images, which have a ground resolution of 30 meters or approximately 100 feet. At this resolution, the satellite sensor "sees" areas that are about a quarter of an acre in size. Within any quarter acre, there may be a number of different landscape features and what the satellite ends up "seeing" is the largest feature or the largest group of similar features. Chances are your house, especially in forested rural areas, will be "dwarfed" by the surrounding trees. This will cause the area to be classified as forest rather than developed. However, if your house is in a neighborhood where houses, driveways, sidewalks, etc. are the predominant landscape features, then it will fall into a "developed" land cover class. Thus, what gets mapped depends on what the predominant landscape features are.
Q. How were the land cover data created?
A. The land cover data were produced from Landsat satellite images using a computer application called image processing. Landsat images are made up of millions of small squares called pixels. Each pixel represents an area on the ground that measures 30 meters by 30 meters. For each pixel, the Landsat image records the amount of reflected energy in 6 narrow bands of the electromagnetic spectrum (red, green and blue visible light, a near-infrared and two mid-infrared bands). Because landscape features reflect light differently, we can use reflectance data to identify areas of deciduous forest, coniferous forest, water, etc. This is where the image processing software is so helpful. Rather than you or me having to analyze data for each pixel, the software can do it much faster, and with the help of image analysts, can assign pixels to land cover classes based on differences and/or similarities in reflectance values. For details about image processing methods used, visit The Project page.
Q. Is the land cover data correct?
A. Of course we'd like to think that the datasets are error free but the reality is that there are misclassification errors. A great deal of time was spent to avoid and correct errors. A variety of ancillary data sources such as USGS topographic maps and orthophotos, were used to aid the classification process. An accuracy assessment is under way so that we can quantitatively assess the accuracy of each land cover map. However, as of December 2008, we have not yet completed the accuracy assessment.
Q. Why not use more detailed satellite imagery to make more detailed maps?
A. There are several reasons why we chose Landsat imagery for the Land Cover Project.
High resolution datasets were not used for the regional analysis for these reasons:
|
Coverage |
File Size |
Number of scenes to cover 13,000 sq. miles |
File size of images of cover 13,000 sq. miles |
Processing Time |
Landsat Scene |
~13,000 |
365Mb |
1 |
365Mb |
Manageable |
Quickbird* Scene |
~100 |
326Mb |
136 |
~43Gb |
Unmanageable |
*Quickbird is a high resolution satellite with 2.4 meter pixels (Landsat has 30 meter pixels)
Too many scenes. Images captured from high resolution satellites have much smaller footprints (area covered on the earth) then Landsat images. It would be difficult to create a seamless dataset from so many images.
Limited historical archive. Commercial high resolution imagery has only been available since the late 1990's. The limited archive would prohibit meeting the project objective - to derive a time series of land cover over a 20+ year period.
Likelihood of seasonal and temporal variability. Because so many scenes would be required to cover the study area, it is likely that images would be captured on many different days, introducing artifacts such as variations in vegetation phenology and atmospheric effects (haze).
Classification Methodology. Classification techniques applied to the Landsat images in this project do not work well on high resolution imagery. New techniques and software would need to be used. Currently, the software does not adequately handle extremely large datasets.
High Cost. High resolution satellites are operated commercially and not by the government, they are expensive, especially for the huge number of images necessary to cover the area.
Project Objectives. The objective of the project was to create a regional assessment. Detail available in high resolution images actually makes it more difficult to provide regional information.
 |
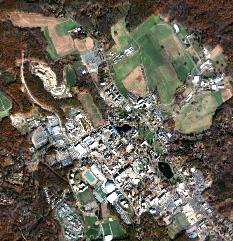 |
A Landsat image (30 meter resolution ) of the UConn campus (left) and a Quickbird satellite image (2.4 meter resolution) of the same area. |
|
Q. Why doesn't the data go back farther in time?
A. The first Landsat satellite was launched in 1972. However, it acquired imagery at 80-meter resolution, which is too coarse for this project, and in different bands of the electro-magnetic spectrum. Since we wanted to create land cover data sets that were comparable, we need to use spatially and spectrally consistent imagery. The first Landsat satellite to acquire 30-meter resolution imagery was launched in 1982.
Q. Does the land cover data show land use?
A. No. With Landsat imagery it is possible to consistently and accurately determine what is on the land's surface but it's not possible to determine how the land is being used. For example, at 30-meter resolution, a group of homes, a group of farm buildings or a group of small offices may reflect light similarly. It's possible to classify the group as developed land but it's difficult, if not impossible, to determine reliably how the buildings are being used.
Q. Does the land cover show all increases in developed land?
A. The land cover data certainly show an increase in developed land between any two time periods. However, it is likely that isolated or small development, especially within forested areas, may be missed due to the spatial resolution of the Landsat imagery. Therefore, we consider this to be a conservative measure of development. It's also worth mentioning that for the developed land cover class, the land cover data only show the actual developed potion of any particular site. In other words, if a 100 acre parcel is developed as a business park, only that portion that includes buildings, parking lots, roads etc. will be depicted as developed. Any vacant portion of such a site would be classified based on the predominant land cover - forest, non-forested wetland, turf & grass, etc.
Q. Where can I get a copy of the land cover data?
A. Any of the land cover data can be downloaded from the download portion of this website as Imagine raster files. All the data are in Connecticut State Plane Coordinates, NAD 83 and are in units of feet. To help CLEAR researchers understand how the land cover data are being used and to notify users via e-mail of new derived data products, we are requesting that you register prior to downloading the data. A simple easy-to-complete on-line form is provided for this purpose.
More questions? Email us.
The 1985, 1990, 1995, 2002 and 2006 land cover data were developed to provide a synoptic view of Connecticut's landscape. Admittedly, the data extend beyond Connecticut's borders to include intersecting local watersheds and Massachusetts towns that are part of the Quinebaug and Shetucket Rivers Valley National Heritage Corridor. The data provide a regional assessment that is not meant for site-level mapping or analysis.
All satellite-derived land cover maps contain error. A great deal of time and effort was spent to minimize errors but, because millions of pixels (literally) make up each land cover dataset, some errors will exist. Common sources of error listed below.
Satellites capture and store information in pixels (picture elements). Together, pixels create an image. The Landsat TM and ETM images have pixels that cover a square on the earth that is 30 meters on a side (~100 feet). This medium resolution is appropriate and valuable for regional analysis. It does not provide detail that is available in higher resolution images.
Each pixel of the land cover maps covers a 30 meter square (~100 feet) of the earth. Often, that 30 meter square is covered by one land cover class, such as trees that define forest or buildings that define developed. When a pixel covers a square that contains more then one class, it is called a mixed pixel. Every effort is taken to correctly classify the mixed pixels into the majority class, however, error can result when classifying mixed pixels.
homogeneous forest pixel |
homogeneous developed pixel |
mixed pixel with a building (developed), trees (forest), and lawn (turf and grass) |
mixed pixel with a road (developed) and trees (forest) |
A demonstration of mixed pixels. The yellow outline represents the coverage of a 30 meter Landsat pixel. An aerial photo shows what might be on the ground within each example pixel. (A) and (B) represent homogeneous pixels and (C) and (D) are examples of mixed pixels. |
|||
Satellites see, or capture information, based on what is visible from above. Sometimes features on the earth can be "hidden" by other features. For example, houses or buildings are sometimes hidden underneath forest canopy. The land cover classification may miss houses and other structures in older neighborhoods with many large, tall trees and classify these areas as forest instead of developed. However, through the use of the rasterized roads layer, older residential developments will be identified in the land cover. Also, old and new houses may be missed if they are built in the forest with little or no clearing.
Class |
Description |
|
No Change Classes |
||
Developed before 1985 |
Areas (pixels) developed before the 1985 satellite image was captured. | |
Turf & Grass |
Areas (pixels) that were turf and grass before the 1985 satellite image was captured. | |
Water |
Any pixel that was water in at least one of the four land cover maps. | |
Undeveloped |
Pixels still undeveloped* on the 2002 Land Cover Map. | |
Change Classes |
Change from Undeveloped to . . . |
|
Developed 1985-1990 |
Areas (pixels) undeveloped* in 1985 and developed in 1990. | |
Turf & Grass 1985-1990 |
Areas (pixels) undeveloped* in 1985 and turf and grass in 1990. | |
Developed 1990-1995 |
Areas (pixels) undeveloped* in 1990 and developed in 1995. | |
Turf & Grass 1990-1995 |
Areas (pixels) undeveloped* in 1990 and turf and grass in 1995. | |
Developed 1995-2002 |
Areas (pixels) undeveloped* in 1995 and developed in 2002. | |
Turf & Grass 1995-2002 |
Areas (pixels) undeveloped* in 1995 and turf and grass in 2002. | |
Developed 2002-2006 |
Areas (pixels) undeveloped* in 2002 and developed in 2006. | |
Turf & Grass 2002-2006 |
Areas (pixels) undeveloped* in 2002 and turf and grass in 2006. | |
*Here, undeveloped includes deciduous forest, coniferous forest, non-forested wetlands, forested wetlands, tidal wetlands, barren, and utility rights-of-way.
Class |
Description |
|
No Change Classes |
||
Developed before 1985 |
Areas (pixels) developed before the 1985 satellite image was captured. | |
Turf & Grass |
Areas (pixels) that were turf and grass before the 1985 satellite image was captured. | |
Water |
Any pixel that was water in at least one of the four land cover maps. | |
Undeveloped/Other |
Pixels still undeveloped* on the 2002 Land Cover Map. | |
Change Classes |
Change from Undeveloped to . . . |
|
Agricultural Field to Developed |
Areas (pixels) that were Agricultural Field in 1985 and developed in 2006. | |
Agricultural Field to Turf & Grass |
Areas (pixels) Agricultural Field in 1985 and turf and grass in 2006. | |
Forest to Developed |
Areas (pixels) Forest* in 1985 and developed in 2006. | |
Forest to Turf & Grass |
Areas (pixels) Forest* in 1985 and turf and grass in 2006. | |
Other Classes to Developed |
Areas (pixels) belonging to other undeveloped classes** in 1985 and developed in 2006. | |
Other Classes to Turf & Grass |
Areas (pixels) belonging to other undeveloped classes** in 1985 and turf and grass in 2006. | |
* Forest includes deciduous forest, coniferous forest, forested wetlands and utility rights-of-way.
* Other undeveloped classes includes other grasses, non-forested wetland, tidal wetlands and barren.