What We're Measuring
Introduction
Given the importance of the public debate on development patterns and their
impacts, it’s critical that studies like Connecticut’s
Changing Landscape be clear about their methods and subsequent interpretations.
This section of the website is offered as a quick, visual guide
to help the viewer understand the basics of remote sensing, the
limitations inherent in using Landsat imagery, and how our definition
of “developed” land might differ from that used by other
studies. Please see also The Project section for fact sheets and other information on proper uses of
the data.
All images cover the same geographic area |
|
|
|
|
80 meter pixel imagery
Landsat MSS |
30 meter pixel imagery
Landsat TM/ETM
|
4 meter pixel imagery
IKONOS |
0.25 foot pixel image
High resolution aerial
|
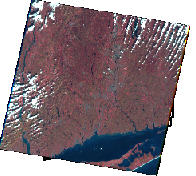
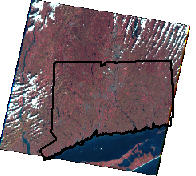
A Quick Remote Sensing Primer
Remote
sensing is the art and science of detecting, identifying,
classifying, and analyzing the earth’s surface using
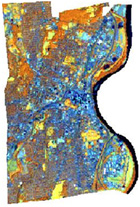
special sensors onboard aircraft and satellites. The image
below is a Landsat TM image of the greater Connecticut
area (Long Island Sound is the dark area near the bottom).
All
objects reflect energy (light) differently, giving them a
unique “spectral” signature. As sunlight strikes
an object (buildings, trees, water, etc.), the energy that
is reflected is collected by sensors aboard aircrafts or
satellites. This creates both a database and a remotely sensed
image. |
|
|
|
|
The
height of each bar indicates the amount of light reflected for that
color. The color of highest reflectance is what we see. |
Understanding 30-meter Resolution
Resolution
is the smallest possible level of detail of a given sensor (for
you cartographers, the “minimum mapping unit.”) No feature
on our land cover maps can be smaller than our minimum unit, which
is 30 meters – that’s about 10,000 square feet, or ¼ acre.
Thus, small features are often missed, and each square, or pixel,
represents our best estimate as to the predominant land cover of
that pixel.
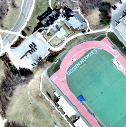
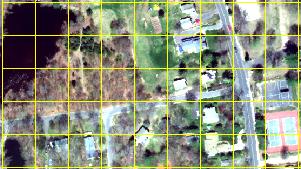
To
the right is a high resolution aerial photograph, with a 30 meter
resolution grid superimposed. Pixel #1 is a homogenous pixel
almost covered with trees, and would likely be interpreted by our
project as a forested pixel. Pixel #2 is a “mixed pixel”
with both vegetation and a large house; because the house covers
a good portion of the pixel, this one would likely be interpreted
as a “developed” pixel. Pixel #3, however, has
a smaller structure, and might be interpreted as either “forest”
or “developed,” depending on how the computer interprets
the data.
|
 |
Images
to Land Cover
Computer
programs and human expertise then turn the database/image into
a land cover map. Land cover is what’s on the surface
of the earth (forest), as opposed to land use, which is what
is planned, practiced or permitted (park, wildlife sanctuary).
While
the image itself is useful and instructive, it is still a picture.
The resultant land cover data, however, can be quantified to
show overall land cover patterns. To the right are examples
from Hartford.
 |
 |
|
Satellite Image (Hartford) |
|
Land Cover Map
(Hartford) |
The
pictures below summarize the process.
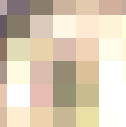
We
have zoomed way in on a Landsat TM image (#1) so that each
individual pixel is visible. Each pixel covers a 30 meter (100
foot) square on the ground. |
1 |
|
|
| |
|
|
|
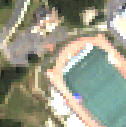
For
illustration purposes, a high resolution image (#2) is
shown of the same area overlain with a 30m grid. The grid represents
the size of the pixels in the Landsat image (#1).
|
2 |
|
|
| |
|
|
|
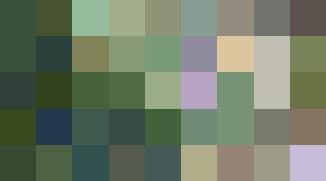
Computer
algorithms are used to classify each pixel into a land cover class
based on the most prevalent spectral signature (#3). |
3 |
|
|
| |
|
|
|
The result is a land cover map (#4). |
4 |
|
|
What we Mean by Developed
Terms
like “urban area,” “developed land” and “development” can
mean different things to different people. We want to be sure
that you understand what our data shows, because the “developed
area” estimated by our remote sensing techniques may be
very different from the “developed area” as shown
in your town comprehensive plan.
Below
are two maps of Marlborough, CT. The left map shows a fairly
typical town map of land use/land cover, interpreted from aerial
photographs. The first four colors (orange, red, black and
pink) could be called “developed” areas. The map
on the right is our satellite-derive land cover map. The red
and yellow areas constitute the "developed” portion
of our map. While you can see that both maps are pretty similar,
the town map shows more developed area. This is because of
the different techniques used.
 |
 |
Land Use/Land Cover Map
derived from aerial photographs |
Land Cover Map
derived from satellite images |
|
|
Pixels vs. Parcels
Below
are four different maps of a 117 lot residential area in Marlborough,
CT. Each accurately measures “developed” land
correctly, but using different techniques that arrive at very
different results. Building footprints and roads, except in
the “Planimetric” map to the left, are used for reference
only.
|
Remote
sensing derived land cover map
|
 |
 |
|
30%
developed |
Technique: Created from digitizing aerial photographs, showing outlines of
houses, driveways, roads and outbuildings.
|
Technique: Land cover depicted as 30 meter (~100 ft per side) pixels representing
predominant reflective signature of each pixel.
|
Possible
uses: An accurate way of determining the amount of impervious
surfaces for runoff modeling, estimating impacts on water resources.
|
Possible uses: Good for town, regional or statewide planning purposes. Generally shows what is on the land within the limits of the resolution of the data.
|
Generalized land cover map
|
|
 |
 |
|
|
Technique: Developed
area drawn by hand around developed areas as “eyeballed” from
planimetric, aerial photo, ground survey or other type of image.
|
Technique: Parcel
(property boundary) data depicted as “developed” if
a structure is on it or if it can not be used for residential
use (e.g. it’s all wetlands, open space set aside, etc.)
|
Possible uses: Common type of map seen in town plans. Good
for general planning purposes but highly subjective.
|
Possible uses: Shows land that is currently or potentially
committed to developed uses. Good for build-out analyses
or to identify developed vs. developable land.
|
Land Cover and Change Categories
Land Cover Category Descriptions
|
Class |
Description |
| |
Developed |
High-density built-up areas typically associated with commercial, industrial and residential activities and transportation routes. These areas can be expected to contain a significant amount of impervious surfaces, roofs, roads, and other concrete and asphalt surfaces. |
| |
Turf
& Grass |
A compound category of undifferentiated maintained grasses associated mostly with developed areas. This class contains cultivated lawns typical of residential neighborhoods, parks, cemeteries, golf courses, turf farms, and other maintained grassy areas. Also includes some agricultural fields due to similar spectral reflectance properties. |
| |
Other
Grasses |
Includes non-maintained grassy areas commonly found along transportation routes and other developed areas, and within and surrounding airport properties. Also likely to include forested clear-cut areas, and some abandoned agricultural areas that appear to be undergoing conversion to woody scrub and shrub cover. |
| |
Agricultural Field |
Includes areas that are under agricultural uses such as crop production and/or active pasture. Also likely to include some abandoned agricultural areas that have not undergone conversion to woody vegetation. |
| |
Deciduous
Forest |
Includes southern New England mixed hardwood forests. Also includes scrub areas characterized by patches of dense woody vegetation. May include isolated low density residential areas. |
| |
Coniferous
Forest |
Includes southern New England mixed softwood forests. May include isolated low density residential areas. |
| |
Water |
Open water bodies and watercourses with relatively deep water. |
| |
Non-forested
Wetland |
Includes areas that predominately are wet throughout most of the year and that have a detectable vegetative cover (therefore not open water). Also includes some small water courses due to spectral characteristics of mixed pixels that include both water and vegetation. |
| |
Forested
Wetland |
Includes areas depicted as wetland, but with forested cover. Also includes some small water courses due to spectral characteristics of mixed pixels that include both water and vegetation. |
| |
Tidal
Wetland |
Emergent wetlands, wet throughout most of the year, with distinctive marsh vegetation and located in areas influenced by tidal change. |
| |
Barren |
Mostly non-agricultural areas free from vegetation, such as sand, sand and gravel operations, bare exposed rock, mines, and quarries. Also includes some urban areas where the composition of construction materials spectrally resembles more natural materials. Also includes some bare soil agricultural fields. |
| |
Utility
Rights-of-way (Forest) |
Includes utility rights-of-way. This category was manually digitized on-screen from rights-of-way visible in the Landsat satellite imagery. The class was digitized within the deciduous and coniferous categories only. |
Change
To Category Descriptions
| |
| |
Developed
before 1985 |
Areas
(pixels) developed before the 1985 satellite image was captured. |
| |
Turf
& Grass |
Areas
(pixels) that were turf and grass before the 1985 satellite image
was captured. |
| |
Water |
Any
pixel that was water in at least one of the four land cover maps. |
| |
Undeveloped |
Pixels
still undeveloped* on the 2002 Land Cover Map. |
| |
Developed
1985-1990 |
Areas
(pixels) undeveloped* in 1985 and developed in 1990. |
| |
Turf
& Grass 1985-1990 |
Areas
(pixels) undeveloped* in 1985 and turf and grass in 1990. |
| |
Developed
1990-1995 |
Areas
(pixels) undeveloped* in 1990 and developed in 1995. |
| |
Turf
& Grass 1990-1995 |
Areas
(pixels) undeveloped* in 1990 and turf and grass in 1995. |
| |
Developed
1995-2002 |
Areas
(pixels) undeveloped* in 1995 and developed in 2002. |
| |
Turf
& Grass 1995-2002 |
Areas
(pixels) undeveloped* in 1995 and turf and grass in 2002. |
| |
Developed
2002-2006 |
Areas
(pixels) undeveloped* in 2002 and developed in 2006. |
| |
Turf
& Grass 2002-2006 |
Areas
(pixels) undeveloped* in 2002 and turf and grass in 2006. |
*Here,
undeveloped includes deciduous forest, coniferous forest, non-forested
wetlands, forested wetlands, tidal wetlands, barren, and utility rights-of-way.
Change
From Category Descriptions
| |
| |
Developed
before 1985 |
Areas
(pixels) developed before the 1985 satellite image was captured. |
| |
Turf
& Grass |
Areas
(pixels) that were turf and grass before the 1985 satellite image
was captured. |
| |
Water |
Any
pixel that was water in at least one of the four land cover maps. |
| |
Undeveloped/Other |
Pixels
still undeveloped* on the 2002 Land Cover Map. |
| |
Agricultural Field to Developed |
Areas
(pixels) that were Agricultural Field in 1985 and developed in 2006. |
| |
Agricultural Field to Turf & Grass |
Areas
(pixels) Agricultural Field in 1985 and turf and grass in 2006. |
| |
Forest to Developed |
Areas
(pixels) Forest* in 1985 and developed in 2006. |
| |
Forest to Turf
& Grass |
Areas
(pixels) Forest* in 1985 and turf and grass in 2006. |
| |
Other Classes to Developed |
Areas
(pixels) belonging to other undeveloped classes** in 1985 and developed in 2006. |
| |
Other Classes to Turf
& Grass |
Areas
(pixels) belonging to other undeveloped classes** in 1985 and turf and grass in 2006. |
* Forest includes deciduous forest, coniferous forest, forested wetlands and utility rights-of-way. * Other undeveloped classes includes other grasses, non-forested wetland, tidal wetlands and barren.
|