College of Agriculture and Natural Resources
Center for Land Use Education and Research

1985 Forest Fragmentation
1990 Forest Fragmentation
1995 Forest Fragmentation
2002 Forest Fragmentation
2006 Forest Fragmentation
1985-2006 Forest Fragmentation Change
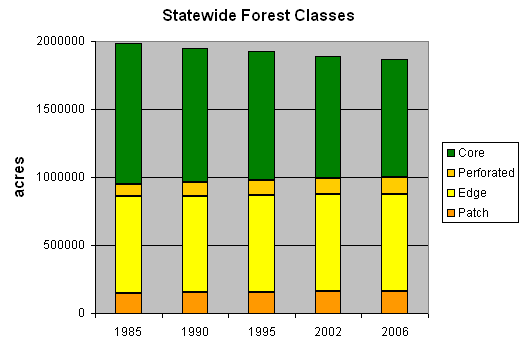
Statewide Forest Bar Chart
Statewide Core Forest Bar Chart
Pie Charts
Core Forest Charts
![]()
Click on the links to the left to see statewide maps and charts. Don't forget to scroll down for the summary data table below!
Follow these links for a description of the forest categories or to see a visual explanation of the forest categories. For information organized by towns or watersheds, visit Your Town or Your Watershed.
You may also want to visit the land cover "Statewide" page. To download the GIS files, visit the download data page. Finally, don't miss the FAQ page.
1985 Statewide Forest Fragmentation |
|
|
 |
1990 Statewide Forest Fragmentation |
|
|
|
1995 Statewide Forest Fragmentation |
|
|
|
2002 Statewide Forest Fragmentation |
|
|
|
2006 Statewide Forest Fragmentation |
|
|
|
1985-2006 Statewide Forest Fragmentation Change |
|
|
 |
|
A bar graph showing forest class change in Connecticut between 1985 and 2006. See the table below for actual values.
|
|
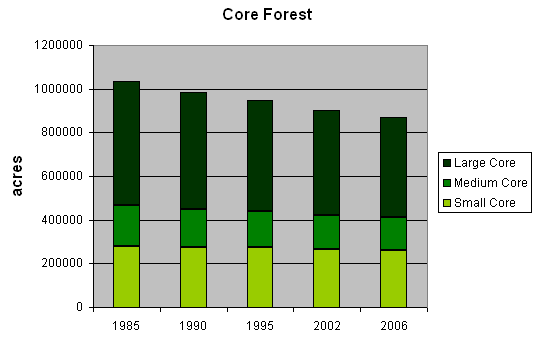
A bar graph showing core forest change in Connecticut between 1985 and 2006. See the table below for actual values.
|
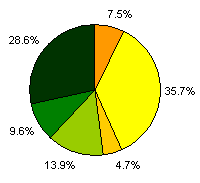
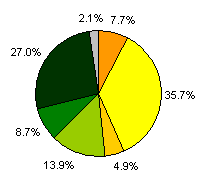
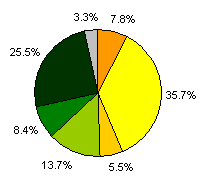
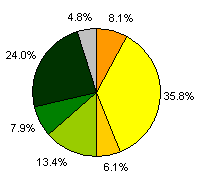
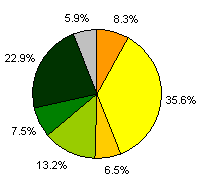
Pies |
|||||||||||||||
|
|||||||||||||||
|
In 1985, there were 1621 square miles of Core Forest in Connecticut. Between 1985 and 2006, 264 square miles of Core Forest were lost. Where did they go?
Take home message: Most of the core forest lost (79%) was lost to the edge and perforated classes, showing piecemeal encroachment of development. * Core forest is gained when a field (other grass or agriculture in 1985) is allowed to grow trees and therefore converts back to forest. |
| FAQ | Caution! | 1985 | 1990 | 1995 | 2002 | 2006 | Change | ||||||
| sq. miles | % of state | sq. miles | % of state | sq. miles | % of state | sq. miles | % of state | sq. miles | % of state | sq. miles | change in % | |
| Patch Forest | 233 | 4.7% | 238 | 4.8% | 243 | 4.9% | 251 | 5.0% | 258 | 5.2% | 26 | 0.5% |
| Edge Forest | 1109 | 22.3% | 1110 | 22.3% | 1109 | 22.3% | 1111 | 22.4% | 1107 | 22.3% | -3 | -0.1% |
| Perforated Forest | 145 | 2.9% | 153 | 3.1% | 171 | 3.4% | 188 | 3.8% | 201 | 4.0% | 56 | 1.1% |
| Small Core Forest | 433 | 8.7% | 431 | 8.7% | 427 | 8.6% | 415 | 8.4% | 411 | 8.3% | -22 | -0.4% |
| Medium Core Forest | 297 | 6.0% | 271 | 5.5% | 262 | 5.3% | 246 | 4.9% | 234 | 4.7% | -64 | -1.3% |
| Large Core Forest | 890 | 17.9% | 837 | 16.9% | 791 | 15.9% | 747 | 15.0% | 711 | 14.3% | -179 | -3.6% |
| Developed | 797 | 16.0% | 862 | 17.4% | 886 | 17.8% | 923 | 18.6% | 942 | 19.0% | 145 | 2.9% |
| Non-forest | 892 | 17.9% | 897 | 18.1% | 915 | 18.4% | 928 | 18.7% | 944 | 19.0% | 52 | 2.9% |
| Water | 173 | 3.5% | 169 | 3.4% | 164 | 3.3% | 161 | 3.2% | 161 | 3.2% | -12 | 1.0% |
| Total Core Forest | 1620 | 32.6% | 1540 | 31.0% | 1481 | 29.8% | 1407 | 28.3% | 1356 | 27.3% | -264 | -3.6% |
| Total Forest | 3107 | 62.5% | 3041 | 61.2% | 3004 | 60.5% | 2958 | 59.5% | 2922 | 58.8% | -185 | -3.7% |