The following data layers are part of the Connecticut Land Cover Viewer and the Long Island Sound Watershed Viewer.
Land Cover (1985, 1990, 1995, 2002, 2006, 2010, 2015)
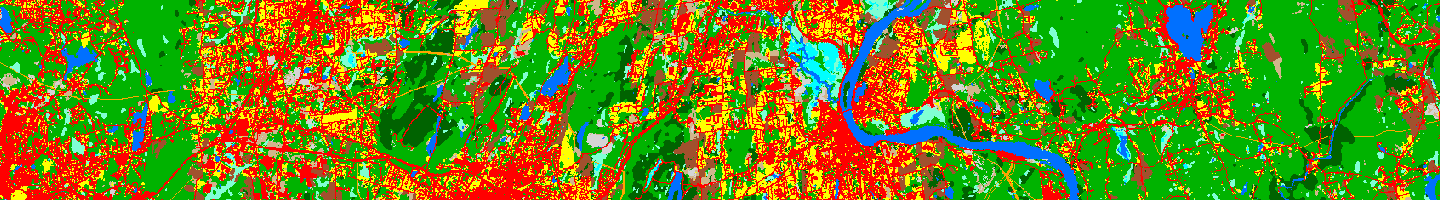
Land Cover Change To (1985-2015)
Land Cover Change From (1985-2015)
Forest Fragmentation (1985, 2015)
Land Cover (1985, 1990, 1995, 2002, 2006, 2010, 2015)
Land Cover Change To (1985-2015)
Land Cover Change From (1985-2015)
Impervious Surface Estimate by Basin
Percent Impervious Change by Basin (1985-2015)
Riparian Area Land Cover (1985, 2015)
Riparian Area Land Cover Change (1985-2015)
 Land cover created with Landsat imagery. Seven dates of land cover are available from each of the following years: 1985, 1990, 1995, 2002, 2006, 2010, 2015.
Note that the map services contain multiple layers. The last layer is the full land cover. The other layers contain on or several classes only.
Map Services for Connecticut:
CTlandcover1985
CTlandcover1990
CTlandcover1995
CTlandcover2002
CTlandcover2006
CTlandcover2010
CTlandcover2015
Map Services for
Long Island Sound Watershed:
LISlandcover1985
LISlandcover1990
LISlandcover1995
LISlandcover2002
LISlandcover2006
LISlandcover2010
LISlandcover2015
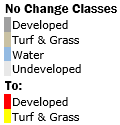 Changes in land cover between 1985 and 2015 with an emphasis on new developed and turf & grass areas.
Map Service Connecticut:
CTchangeTo1985_2015
Map Service for Long Island Sound Watershed:
LISchangeTo1985_2015
 Changes in land cover between 1985 and 2015 with an emphasis on what land covers were lost.
Map Service for Connecticut:
CTchangeFrom1985_2015
Map Service for Long Island Sound Watershed:
LISchangeFrom1985_2015
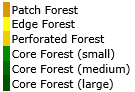 The Forest Fragmentation map takes the forest land cover classes (including deciduous forest, coniferous forest, forested wetland and utility right of way) and classifies these areas into patch, edge, perforated or core forest. The analysis was only completed for Connecticut. Learn more.
Map Services for Connecticut:
CTforestfrag1985
CTforestfrag2015
 The layer shows impervious surface estimates created by applying coefficients to the land cover classes. The analysis was performed for each date of land cover using HUC 12 watersheds. Learn more.
Layer Names
1985 Percent Impervious
1990 Percent Impervious
1995 Percent Impervious
2002 Percent Impervious
2006 Percent Impervious
2010 Percent Impervious
2015 Percent Impervious
 The layer shows the change, in percent, of the impervious surface estimates for HUC 12 watersheds. Learn more.
Layer Names
Percent Impervious Change 1985-2015
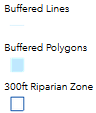 The riparian area is a 300 foot zone around streams and waterbodies and tidal marsh complexes. The polygon layers includes the waterbodies and tidal marshes where shorelines were buffered. The lines are streams that were buffered on both side. The Riparian Zone shows the resulting riparian area. The land cover was clipped by this area for land cover analysis in the riparian zone.
Layer Names:
Buffered Lines
Buffered Polygons
300ft Riparian Zone
The riparian area is land closest to water in the form of streams, rivers, lakes and tidal marshes. The riparian land cover shows the land cover types within the riparian zone at that date. Learn more.
Map Services for Long Island Sound Watershed:
Riparian Zone Land Cover 1985
Riparian Zone Land Cover 2015
The riparian area is land closest to water in the form of streams, rivers, lakes and tidal marshes. The riparian land cover change shows the land cover change between 1985 and 2015 within the riparian zone. Learn more.
The land cover has been summarized by town. The resulting town maps show trends like which towns have more forest than others and which have experienced more change in a specific land cover class.
Layer Names:
Forest
Forest Change
Ag Field
Ag Field Change
Developed
Developed Change
Turf and Grass
Turf and Grass Change
Town Stats
The land cover has been summarized by HUC 12 watershed. The resulting watershed maps show trends like which watersheds have more forest than others and which have experienced more change in a specific land cover class.
Layer Names:
Forest
Forest Change
Ag Field
Ag Field Change
Developed
Developed Change
Turf and Grass
Turf and Grass Change
Basin Stats