Long Island Sound Watershed
The term riparian refers to the land immediately adjacent to water bodies such as streams, ponds and lakes. These areas are known to provide a number of environmental amenities, including wildlife habitat, temperature moderation, and processing of pollutants.
The map below shows just the riparian layers. To see them in context with other land cover layers, visit the Long Island Sound Watershed Land Cover Viewer.
CLEAR researchers created a seamless, continuous “object to be buffered” GIS data layer. This “to be buffered” feature includes the boundaries (shorelines) of wetlands and waterbodies contiguous with the stream lines. For example, along the coast, the riparian areas studied begin at the outer edge of the tidal wetlands, not at the stream edge. This provides a more complete picture of development pressures infringing on water resources. Inland wetlands and small waterbodies not directly connected to the stream lines as determined by the state data layers were not included in this study.

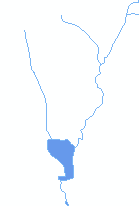
Water includes streams and the boundaries of waterbodies and tidal wetlands.

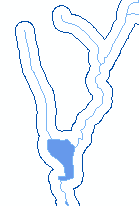
The water was buffered by 300 feet (dark blue line)

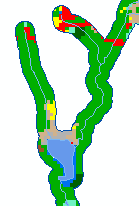
The land cover was clipped by the 300 ft buffer area.

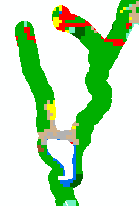
The riparian area land cover is the land cover occuring within 300 feet of a water line or waterbody/wetland shore.
Visit the Connecticut Habitats website for more on Riparian Zones.
1985 |
1990 |
1995 |
2002 |
2006 |
2010 |
2015 |
Change |
||||||||||
Class |
sq. miles | % of area | sq. miles | % of area | sq. miles | % of area | sq. miles | % of area | sq. miles | % of area | sq. miles | % of area | sq. miles | % of area | sq. miles | % of area | |
| Developed | 206.0 | 15.0% | 221.0 | 16.1% | 226.0 | 16.4% | 233.2 | 17.0% | 236.5 | 17.2% | 237.3 | 17.3% | 238.1 | 17.3% | 32.1 | 2.3% | |
| Turf & Grass | 73.4 | 5.3% | 77.6 | 5.6% | 81.4 | 5.9% | 86.1 | 6.3% | 90.7 | 6.6% | 91.3 | 6.6% | 91.4 | 6.6% | 18.0 | 1.3% | |
| Other Grasses | 20.6 | 1.5% | 22.3 | 1.6% | 29.6 | 2.1% | 30.1 | 2.2% | 27.2 | 2.0% | 28.7 | 2.1% | 26.1 | 1.9% | 5.5 | 0.4% | |
| Agricultural Field | 97.8 | 7.1% | 93.9 | 6.8% | 91.3 | 6.6% | 87.4 | 6.4% | 85.8 | 6.2% | 85.8 | 6.2% | 85.6 | 6.2% | -12.2 | -0.9% | |
| Deciduous Forest | 670.7 | 48.8% | 657.6 | 47.8% | 647.3 | 47.1% | 641.2 | 46.6% | 638.8 | 46.5% | 636.9 | 46.3% | 638.7 | 46.4% | -32.0 | -2.3% | |
| Coniferous Forest | 133.5 | 9.7% | 132.2 | 9.6% | 131.4 | 9.6% | 130.6 | 9.5% | 130.1 | 9.5% | 130.0 | 9.5% | 130.2 | 9.5% | -3.3 | -0.2% | |
| Water | 43.3 | 3.1% | 40.1 | 2.9% | 37.7 | 2.7% | 35.9 | 2.6% | 35.3 | 2.6% | 35.5 | 2.6% | 34.5 | 2.5% | -8.8 | -0.6% | |
| Non-forested Wetland | 11.7 | 0.9% | 12.0 | 0.9% | 12.0 | 0.9% | 12.4 | 0.9% | 12.3 | 0.9% | 12.0 | 0.9% | 12.0 | 0.9% | 0.3 | 0.0% | |
| Forested Wetland | 99.8 | 7.3% | 99.3 | 7.2% | 99.2 | 7.2% | 99.1 | 7.2% | 98.8 | 7.2% | 99.1 | 7.2% | 99.1 | 7.2% | -0.7 | -0.1% | |
| Tidal Wetland | 6.0 | 0.4% | 5.9 | 0.4% | 5.8 | 0.4% | 5.8 | 0.4% | 5.7 | 0.4% | 5.7 | 0.4% | 5.7 | 0.4% | -0.3 | 0.0% | |
| Barren Land | 7.5 | 0.5% | 8.6 | 0.6% | 8.9 | 0.6% | 8.9 | 0.6% | 9.4 | 0.7% | 8.3 | 0.6% | 9.2 | 0.7% | 1.6 | 0.1% | |
| Utility Corridor | 4.8 | 0.3% | 4.7 | 0.3% | 4.7 | 0.3% | 4.7 | 0.3% | 4.7 | 0.3% | 4.7 | 0.3% | 4.7 | 0.3% | -0.1 | 0.0% | |