

Findings
Watershed Characterization
1. Watershed Land Cover
The project team collected datasets on the watershed from both the University and the Town of Mansfield. These data can be viewed on the interactive map. A detailed land cover map was created by digitizing recent high resolution aerial imagery (below). To give the team a better idea of retrofit opportunities, impervious cover features were also classified by type (Section 2, below).
View Eagleville Brook Land Cover Map
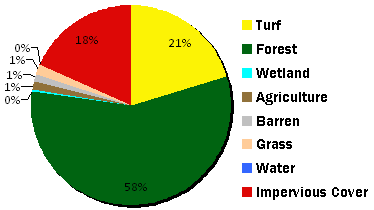
| Land Cover Type | Area (acres) | % of Watershed |
| agriculture | 16.8 | 1.4% |
| barren | 15.8 | 1.3% |
| forest | 682.9 | 56.9% |
| grass | 17.7 | 1.5% |
| turf | 243.6 | 20.3% |
| water | 2.5 | 0.2% |
| wetland | 1.7 | 0.1% |
| impervious cover | 218.4 | 18.2% |
| Total | 1199.2 | 100% |
2. Watershed Impervious Cover by Type
View Eagleville Brook Impervious Cover Map
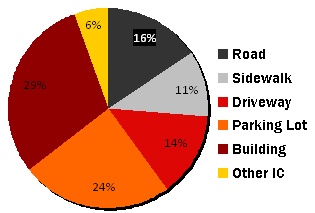
| Impervious Cover Type | Area (acres) | % of Watershed | % of Impervious Cover |
| building | 65.3 | 5.4% | 29.9% |
| parking lot | 53.5 | 4.5% | 24.5% |
| road | 34.1 | 2.9% | 15.7% |
| driveway | 30.0 | 2.5% | 13.7% |
| sidewalk | 23.41 | 2.0% | 10.7% |
| other | 12.1 | 1.0% | 5.5% |
| Total | 218.4 | 18.2% | 100% |
3. Watershed Impervious Cover Estimates and Targets
In July 2009, the project team conducted a four-day field analysis of the watershed. Field work identified important features that could not be determined from the mapping exercise alone. First, the team identified discrepancies in the original watershed boundary as contained in the state hydrography data layer; the revised watershed boundary was about 26 acres less than the original. Second, the team estimated that about 51 acres of the impervious cover in the watershed were effectively disconnected via sheet flow to a large forested area, undetected diversion to another watershed, or through treatment by a recently constructed stormwater practice. Revised impervious cover disconnection targets were made using these adjustments (below).
| Eagleville Brook Watershed | TMDL Estimated | Adjusted with updated mapping | Field Adjusted |
| Watershed drainage area (acres) | 1225 | 1225 | 1199 |
| Watershed IC (acres) | 145 | 218 | 167 |
| Watershed IC (%) | 11.8% | 17.8% | 13.9% |
| 11% IC TMDL target (acres) | 111 | 111 | 132 |
| IC to disconnect/manage to reach target (acres) | 34 | 107 | 35 |
Table 1. Existing conditions in Eagleville Brook. The original estimates were based on modeling using 2002 land cover data with 30m resolution. The second column shows additional impervious cover resulting from updates and improvements using 2008 high resolution satellite imagery. The last column includes field adjustments that decreased the watershed area by 26 acres, and "removed" 51 acres of disconnected IC.