College of Agriculture and Natural Resources
Center for Land Use Education and Research

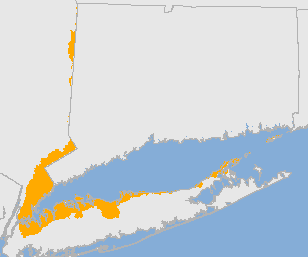 New York Portion of Lower Long Island Sound Watershed
Visit the Viewer to see and compare the maps. Visit the Stats or Maps page to see the breakdown for the HUC12 basins.
| 1985 | 2010 | Change | |||||||
| acres | sq. miles | % | acres | sq. miles | % |
acres | sq. miles | % | |
| Developed | 133611 | 208.8 | 40.8% | 140015 | 218.8 | 42.7% | 6404 | 10.0 | 2.0% |
| Turf & Grass | 42123 | 65.8 | 12.9% | 45743 | 71.5 | 14.0% | 3620 | 5.7 | 1.1% |
| Other Grass | 7182 | 11.2 | 2.2% | 7711 | 12.0 | 2.4% | 529 | 0.8 | 0.2% |
| Ag. Field | 11902 | 18.6 | 3.6% | 10928 | 17.1 | 3.3% | -974 | -1.5 | -0.3% |
| Deciduous Forest | 99652 | 155.7 | 30.4% | 93373 | 145.9 | 28.5% | -6279 | -9.8 | -1.9% |
| Coniferous Forest | 9463 | 14.8 | 2.9% | 8951 | 14.0 | 2.7% | -512 | -0.8 | -0.2% |
| Water | 10091 | 15.8 | 3.1% | 9864 | 15.4 | 3.0% | -227 | -0.4 | -0.1% |
| Non-forested Wetlands | 510 | 0.8 | 0.2% | 450 | 0.7 | 0.1% | -60 | -0.1 | 0.0% |
| Forested Wetlands | 3154 | 4.9 | 1.0% | 2694 | 4.2 | 0.8% | -460 | -0.7 | -0.1% |
| Tidal Wetlands | 3328 | 5.2 | 1.0% | 3161 | 4.9 | 1.0% | -167 | -0.3 | -0.1% |
| Barren | 6389 | 10.0 | 1.9% | 4553 | 7.1 | 1.4% | -1836 | -2.9 | -0.6% |
| Utility ROW (Forest) | 340 | 0.5 | 0.1% | 330 | 0.5 | 0.1% | -10 | 0.0 | 0.0% |
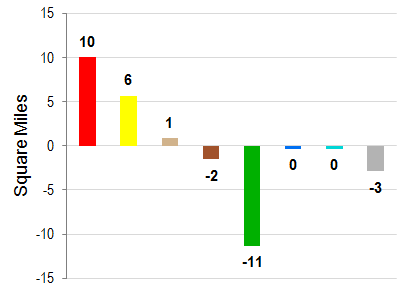
Change in Zone Land Cover, 1985-2010 |
||
 |
|
|
| Developed | ||
| Turf & Grass | ||
| Other Grass | ||
| Agricultural Field | ||
| Forest | ||
| Water | ||
| Wetland | ||
| Barren | ||
| 1985 | 2010 | Change | |||||||
| acres | sq. miles | % | acres | sq. mi | % | acres | sq. miles | % | |
| Developed | 10163 | 15.9 | 26.3% | 10788 | 16.9 | 27.9% | 625 | 1.0 | 1.6% |
| Turf & Grass | 3709 | 5.8 | 9.6% | 4062 | 6.3 | 10.5% | 353 | 0.6 | 0.9% |
| Other Grass | 637 | 1.0 | 1.6% | 849 | 1.3 | 2.2% | 212 | 0.3 | 0.5% |
| Ag. Field | 1416 | 2.2 | 3.7% | 1332 | 2.1 | 3.4% | -84 | -0.1 | -0.2% |
| Deciduous Forest | 15532 | 24.3 | 40.2% | 14975 | 23.4 | 38.8% | -557 | -0.9 | -1.4% |
| Coniferous Forest | 1547 | 2.4 | 4.0% | 1458 | 2.3 | 3.8% | -89 | -0.1 | -0.2% |
| Water | 1917 | 3.0 | 5.0% | 1711 | 2.7 | 4.4% | -205 | -0.3 | -0.5% |
| Non-forested Wetlands | 170 | 0.3 | 0.4% | 161 | 0.3 | 0.4% | -9 | 0.0 | 0.0% |
| Forested Wetlands | 1635 | 2.6 | 4.2% | 1529 | 2.4 | 4.0% | -105 | -0.2 | -0.3% |
| Tidal Wetlands | 761 | 1.2 | 2.0% | 749 | 1.2 | 1.9% | -12 | 0.0 | 0.0% |
| Barren | 1090 | 1.7 | 2.8% | 956 | 1.5 | 2.5% | -134 | -0.2 | -0.3% |
| Utility ROW (Forest) | 39 | 0.1 | 0.1% | 38 | 0.1 | 0.1% | 0 | 0.0 | 0.0% |
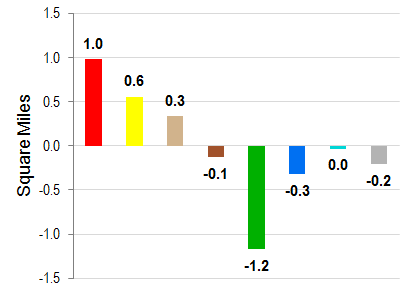
Change in Riparian Zone Land Cover, 1985-2010 |
||
 |
|
|
| Developed | ||
| Turf & Grass | ||
| Other Grass | ||
| Agricultural Field | ||
| Forest | ||
| Water | ||
| Wetland | ||
| Barren | ||
Impervious Cover is not reported by state because Impervious Cover is averaged by watershed and watersheds cross state boundaries.