College of Agriculture and Natural Resources
Center for Land Use Education and Research

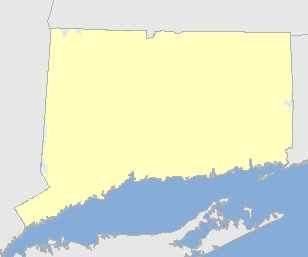 Connecticut Portion of Lower Long Island Sound Watershed
Note that the entire state of Connecticut is not part of the Long Island Sound Watershed. Connecticut is about 4970 square miles (3,181,240 acres) and the watershed area in Connecticut is about 4921 square miles (3,149,531 acres) - a difference of 49 square miles (31,708 acres) (shown in red on the map). The stats below are ONLY for the watershed, which is shown in yellow.
Visit the Interactive map to see and compare the maps. Visit the Statistics or Maps page to see the breakdown for the HUC12 basins.
| 1985 | 2010 | Change | |||||||
| acres | sq. miles | % | acres | sq. miles | % |
acres | sq. miles | % | |
| Developed | 505819 | 790.3 | 16.1% | 600701 | 938.6 | 19.1% | 94882 | 148.3 | 3.0% |
| Turf & Grass | 195695 | 305.8 | 6.2% | 243285 | 380.1 | 7.7% | 47590 | 74.4 | 1.5% |
| Other Grass | 41427 | 64.7 | 1.3% | 60732 | 94.9 | 1.9% | 19305 | 30.2 | 0.6% |
| Ag. Field | 269431 | 421.0 | 8.6% | 229338 | 358.3 | 7.3% | -40093 | -62.6 | -1.3% |
| Deciduous Forest | 1563740 | 2443.3 | 49.6% | 1459510 | 2280.5 | 46.3% | -104230 | -162.9 | -3.3% |
| Coniferous Forest | 289009 | 451.6 | 9.2% | 278844 | 435.7 | 8.9% | -10165 | -15.9 | -0.3% |
| Water | 111010 | 173.5 | 3.5% | 103569 | 161.8 | 3.3% | -7441 | -11.6 | -0.2% |
| Non-forested Wetlands | 12742 | 19.9 | 0.4% | 13055 | 20.4 | 0.4% | 313 | 0.5 | 0.0% |
| Forested Wetlands | 115994 | 181.2 | 3.7% | 110006 | 171.9 | 3.5% | -5988 | -9.4 | -0.2% |
| Tidal Wetlands | 13971 | 21.8 | 0.4% | 14136 | 22.1 | 0.4% | 166 | 0.3 | 0.0% |
| Barren | 19444 | 30.4 | 0.6% | 25408 | 39.7 | 0.8% | 5964 | 9.3 | 0.2% |
| Utility ROW (Forest) | 11250 | 17.6 | 0.4% | 10918 | 17.1 | 0.3% | -331 | -0.5 | 0.0% |
Change in Zone Land Cover, 1985-2010 |
||
 |
|
|
| Developed | ||
| Turf & Grass | ||
| Other Grass | ||
| Agricultural Field | ||
| Forest | ||
| Water | ||
| Wetland | ||
| Barren | ||
| 1985 | 2010 | Change | |||||||
| acres | sq. miles | % | acres | sq. mi | % | acres | sq. miles | % | |
| Developed | 121924 | 190.5 | 14.5% | 141284 | 220.8 | 16.8% | 19360 | 30.3 | 2.3% |
| Turf & Grass | 43311 | 67.7 | 5.1% | 53499 | 83.6 | 6.4% | 10187 | 15.9 | 1.2% |
| Other Grass | 10748 | 16.8 | 1.3% | 16107 | 25.2 | 1.9% | 5359 | 8.4 | 0.6% |
| Ag. Field | 59110 | 92.4 | 7.0% | 52428 | 81.9 | 6.2% | -6682 | -10.4 | -0.8% |
| Deciduous Forest | 417272 | 652.0 | 49.6% | 396673 | 619.8 | 47.1% | -20599 | -32.2 | -2.4% |
| Coniferous Forest | 84207 | 131.6 | 10.0% | 82218 | 128.5 | 9.8% | -1989 | -3.1 | -0.2% |
| Water | 25526 | 39.9 | 3.0% | 20916 | 32.7 | 2.5% | -4610 | -7.2 | -0.5% |
| Non-forested Wetlands | 7055 | 11.0 | 0.8% | 7306 | 11.4 | 0.9% | 251 | 0.4 | 0.0% |
| Forested Wetlands | 61663 | 96.3 | 7.3% | 58634 | 91.6 | 7.0% | -3028 | -4.7 | -0.4% |
| Tidal Wetlands | 3005 | 4.7 | 0.4% | 3107 | 4.9 | 0.4% | 102 | 0.2 | 0.0% |
| Barren | 4865 | 7.6 | 0.6% | 6578 | 10.3 | 0.8% | 1713 | 2.7 | 0.2% |
| Utility ROW (Forest) | 2901 | 4.5 | 0.3% | 2836 | 4.4 | 0.3% | -65 | -0.1 | 0.0% |
Change in Riparian Zone Land Cover, 1985-2010 |
||
 |
|
|
| Developed | ||
| Turf & Grass | ||
| Other Grass | ||
| Agricultural Field | ||
| Forest | ||
| Water | ||
| Wetland | ||
| Barren | ||
Impervious Cover is not reported by state because Impervious Cover is averaged by watershed and watersheds cross state boundaries.