College of Agriculture and Natural Resources
Center for Land Use Education and Research

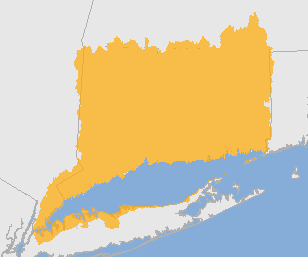 Lower Long Island Sound Watershed Study Area
Visit the Interactive Map to see and compare the maps. Visit the Statistics or Maps page to see the breakdown for the HUC12 basins.
| 1985 | 2010 | Change | |||||||
| acres | sq. miles | % | acres | sq. miles | % |
acres | sq. miles | % | |
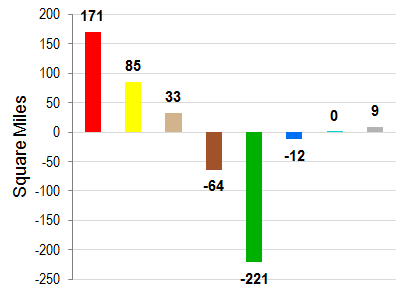
| Developed | 663516 | 1036.8 | 17.7% | 772721 | 1207.4 | 20.7% | 109205 | 170.6 | 2.9% |
| Turf & Grass | 245530 | 383.6 | 6.6% | 300143 | 469.0 | 8.0% | 54613 | 85.3 | 1.5% |
| Other Grass | 52016 | 81.3 | 1.4% | 73198 | 114.4 | 2.0% | 21182 | 33.1 | 0.6% |
| Ag. Field | 296615 | 463.5 | 7.9% | 255382 | 399.0 | 6.8% | -41233 | -64.4 | -1.1% |
| Deciduous Forest | 1789190 | 2795.6 | 47.9% | 1667370 | 2605.3 | 44.6% | -121820 | -190.4 | -3.3% |
| Coniferous Forest | 339151 | 529.9 | 9.1% | 326714 | 510.5 | 8.7% | -12437 | -19.4 | -0.3% |
| Water | 146935 | 229.6 | 3.9% | 139080 | 217.3 | 3.7% | -7855 | -12.3 | -0.2% |
| Non-forested Wetlands | 15102 | 23.6 | 0.4% | 15360 | 24.0 | 0.4% | 258 | 0.4 | 0.0% |
| Forested Wetlands | 130489 | 203.9 | 3.5% | 123359 | 192.7 | 3.3% | -7130 | -11.1 | -0.2% |
| Tidal Wetlands | 18281 | 28.6 | 0.5% | 18168 | 28.4 | 0.5% | -113 | -0.2 | 0.0% |
| Barren | 28569 | 44.6 | 0.8% | 34239 | 53.5 | 0.9% | 5669 | 8.9 | 0.2% |
| Utility ROW (Forest) | 12735 | 19.9 | 0.3% | 12380 | 19.3 | 0.3% | -355 | -0.6 | 0.0% |
Change in Zone Land Cover, 1985-2010 |
||
 |
|
|
| Developed | ||
| Turf & Grass | ||
| Other Grass | ||
| Agricultural Field | ||
| Forest | ||
| Water | ||
| Wetland | ||
| Barren | ||
NOTE: Riparian Zone data only includes Connecticut and New York. It was not processed for Massachusetts or Rhode Island.
| 1985 | 2010 | Change | |||||||
| acres | sq. miles | % | acres | sq. mi | % | acres | sq. miles | % | |
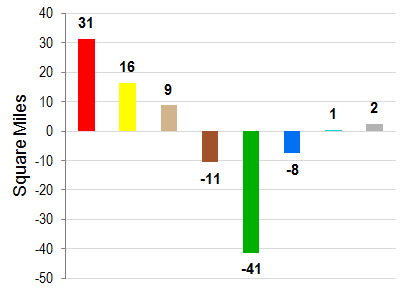
| Developed | 132068 | 206.4 | 15.%0 | 152052 | 237.6 | 17.3% | 19984 | 31.2 | 2.3% |
| Turf & Grass | 47013 | 73.5 | 5.3% | 57552 | 89.9 | 6.5% | 10539 | 16.5 | 1.2% |
| Other Grass | 11384 | 17.8 | 1.3% | 16954 | 26.5 | 1.9% | 5570 | 8.7 | 0.6% |
| Ag. Field | 60509 | 94.5 | 6.9% | 53743 | 84.0 | 6.1% | -6766 | -10.6 | -0.8% |
| Deciduous Forest | 432698 | 676.1 | 49.2% | 411543 | 643.0 | 46.8% | -21155 | -33.1 | -2.4% |
| Coniferous Forest | 85728 | 133.9 | 9.7% | 83649 | 130.7 | 9.5% | -2078 | -3.2 | -0.2% |
| Water | 27457 | 42.9 | 3.1% | 22656 | 35.4 | 2.6% | -4802 | -7.5 | -0.5% |
| Non-forested Wetlands | 7225 | 11.3 | 0.8% | 7466 | 11.7 | 0.8% | 242 | 0.4 | 0.0% |
| Forested Wetlands | 63286 | 98.9 | 7.2% | 60154 | 94.0 | 6.8% | -3132 | -4.9 | -0.4% |
| Tidal Wetlands | 3770 | 5.9 | 0.4% | 3860 | 6.0 | 0.4% | 90 | 0.1 | 0.0% |
| Barren | 5996 | 9.4 | 0.7% | 7563 | 11.8 | 0.9% | 1567 | 2.4 | 0.2% |
| Utility ROW (Forest) | 2940 | 4.6 | 0.3% | 2874 | 4.5 | 0.3% | -65 | -0.1 | 0.0% |
Change in Riparian Zone Land Cover, 1985-2010 |
||
 |
|
|
| Developed | ||
| Turf & Grass | ||
| Other Grass | ||
| Agricultural Field | ||
| Forest | ||
| Water | ||
| Wetland | ||
| Barren | ||
| 1985 | 1990 | 1995 | 2002 | 2006 | 2010 | Change | ||||||||||||||
| acres | sq mi | % | acres | sq mi | % |
acres | sq mi | % | acres | sq mi | % | acres | sq mi | % | acres | sq mi | % | acres | sq mi | |
| 267671 | 418 | 7.1 | 278461 | 435 | 7.4 | 283152 | 442 | 7.5 | 290054 | 453 | 7.7 | 293956 | 459 | 7.8 | 296301 | 463 | 7.9 | 28630 | 45 | |