College of Agriculture and Natural Resources
Center for Land Use Education and Research

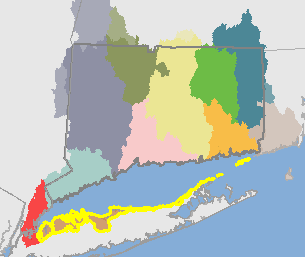 Northern Long Island Basin (02030201)
The Northern Long Island Basin is approximately 286 square miles (182,806 acres).
It includes the following HUC12 basins: Alley Creek-Little Neck Bay, Brown Hills, Cold Spring Harbor-Oyster Bay, Crab Meadow-Fresh Pond, East Creek-Dosoris Pond, Glen Cove Creek-Hempstead Harbor Goldsmith Inlet-Mattituck Creek Huntington Harbor-Lloyd Harbor Mill Neck Creek-Oyster Bay Harbor Mitchells Creek-Manhassett Bay Mt Sinai Harbor-Port Jefferson Harbor Nissequogue River Northport Bay Rocky Point-Wading River West Meadow Creek-Stony Brook Harbor
Visit the Interactive Map to see and compare the maps. Visit the Statistics or Maps page to see the breakdown for the HUC12 basins.
| 1985 | 2010 | Change | ||||
| acres | % | acres | % |
acres | % | |
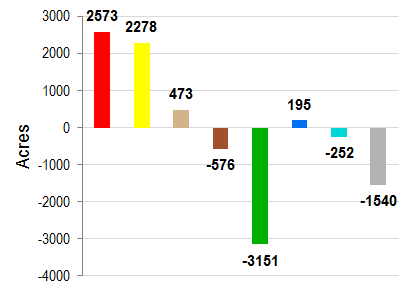
| Developed | 56083 | 37.1% | 58656 | 38.8% | 2573 | 1.7% |
| Turf & Grass | 18458 | 12.2% | 20736 | 13.7% | 2278 | 1.5% |
| Other Grass | 3666 | 2.4% | 4139 | 2.7% | 473 | 0.3% |
| Ag. Field | 4206 | 2.8% | 3630 | 2.4% | -576 | -0.4% |
| Deciduous Forest | 48963 | 32.4% | 46217 | 30.6% | -2745 | -1.8% |
| Coniferous Forest | 4149 | 2.7% | 4011 | 2.7% | -138 | -0.1% |
| Water | 6863 | 4.5% | 7059 | 4.7% | 195 | 0.1% |
| Non-forested Wetlands | 129 | 0.1% | 93 | 0.1% | -35 | 0.0% |
| Forested Wetlands | 1216 | 0.8% | 958 | 0.6% | -259 | -0.2% |
| Tidal Wetlands | 2790 | 1.8% | 2573 | 1.7% | -217 | -0.1% |
| Barren | 4499 | 3.0% | 2959 | 2.0% | -1540 | -1.0% |
| Utility ROW (Forest) | 190 | 0.1% | 182 | 0.1% | -8 | 0.0% |
Change in Zone Land Cover, 1985-2010 |
||
 |
|
|
| Developed | ||
| Turf & Grass | ||
| Other Grass | ||
| Agricultural Field | ||
| Forest | ||
| Water | ||
| Wetland | ||
| Barren | ||
| 1985 | 2010 | Change | ||||
| acres | % | acres | % | acres | % | |
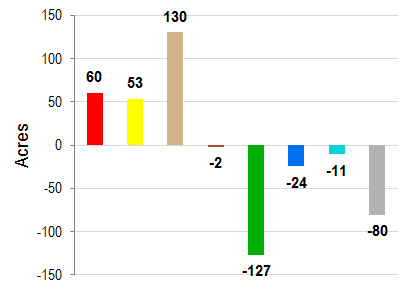
| Developed | 3177 | 29.6% | 3237 | 30.2% | 60 | 0.6% |
| Turf & Grass | 974 | 9.1% | 1028 | 9.6% | 53 | 0.5% |
| Other Grass | 143 | 1.3% | 273 | 2.5% | 130 | 1.2% |
| Ag. Field | 93 | 0.9% | 91 | 0.8% | -2 | 0.0% |
| Deciduous Forest | 3703 | 34.5% | 3594 | 33.5% | -109 | -1.0% |
| Coniferous Forest | 269 | 2.5% | 260 | 2.4% | -9 | -0.1% |
| Water | 572 | 5.3% | 548 | 5.1% | -24 | -0.2% |
| Non-forested Wetlands | 51 | 0.5% | 51 | 0.5% | 0 | 0.0% |
| Forested Wetlands | 564 | 5.2% | 555 | 5.2% | -9 | -0.1% |
| Tidal Wetlands | 463 | 4.3% | 452 | 4.2% | -11 | -0.1% |
| Barren | 724 | 6.7% | 644 | 6.0% | -80 | -0.7% |
| Utility ROW (Forest) | 3 | 0.0% | 3 | 0.0% | 0 | 0.0% |
Change in Riparian Zone Land Cover, 1985-2010 |
||
 |
|
|
| Developed | ||
| Turf & Grass | ||
| Other Grass | ||
| Agricultural Field | ||
| Forest | ||
| Water | ||
| Wetland | ||
| Barren | ||
| 1985 | 1990 | 1995 | 2002 | 2006 | 2010 | Change | |||||||
| acres | % | acres | % |
acres | % | acres | % | acres | % | acres | % | acres | % |
| 21973 | 3.3% | 22239 | 3.3% | 22329 | 3.3% | 22478 | 3.3% | 22528 | 3.3% | 22743 | 3.4% | 770 | 0.1% |