College of Agriculture and Natural Resources
Center for Land Use Education and Research

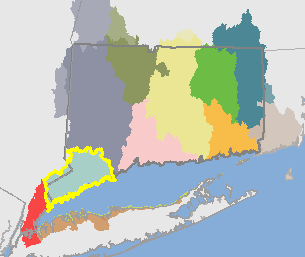 Saugatuck Basin (01100006)
The Saugatuck River Basin is approximately 450 square miles (287,614 acres).
It includes the following HUC12 basins: Aspetuck River, Blind Brook-Horseneck Brook, Byram River, Fivemile River, Headwaters Saugatuck River, Mianus River, Mill River-Frontal Long Island Sound, Norwalk River-Frontal Norwalk Harbor, Outlet Saugatuck River-Frontal Long Island Sound, Pequonnock River-Frontal Long Island Sound, Rippowam River, Rooster River-Frontal Long Island Sound, and Silvermine River .
Visit the Interactive Map to see and compare the maps. Visit the Statistics or Maps page to see the breakdown for the HUC12 basins.
| 1985 | 2010 | Change | ||||
| acres | % | acres | % |
acres | % | |
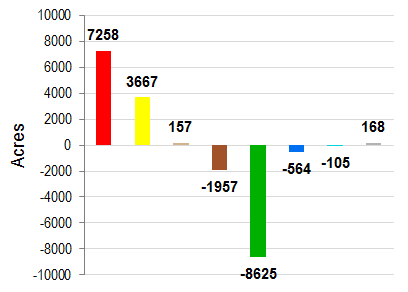
| Developed | 87821 | 30.5% | 95079 | 33.1% | 7258 | 2.5% |
| Turf & Grass | 42452 | 14.8% | 46119 | 16.0% | 3667 | 1.3% |
| Other Grass | 3276 | 1.1% | 3433 | 1.2% | 157 | 0.1% |
| Ag. Field | 5057 | 1.8% | 3099 | 1.1% | -1957 | -0.7% |
| Deciduous Forest | 118041 | 41.0% | 110834 | 38.5% | -7206 | -2.5% |
| Coniferous Forest | 11361 | 4.0% | 10525 | 3.7% | -836 | -0.3% |
| Water | 8531 | 3.0% | 7967 | 2.8% | -564 | -0.2% |
| Non-forested Wetlands | 337 | 0.1% | 333 | 0.1% | -4 | 0.0% |
| Forested Wetlands | 7492 | 2.6% | 6900 | 2.4% | -592 | -0.2% |
| Tidal Wetlands | 1329 | 0.5% | 1229 | 0.4% | -100 | 0.0% |
| Barren | 1591 | 0.6% | 1759 | 0.6% | 168 | 0.1% |
| Utility ROW (Forest) | 327 | 0.1% | 336 | 0.1% | 10 | 0.0% |
Change in Zone Land Cover, 1985-2010 |
||
 |
|
|
| Developed | ||
| Turf & Grass | ||
| Other Grass | ||
| Agricultural Field | ||
| Forest | ||
| Water | ||
| Wetland | ||
| Barren | ||
| 1985 | 2010 | Change | ||||
| acres | % | acres | % | acres | % | |
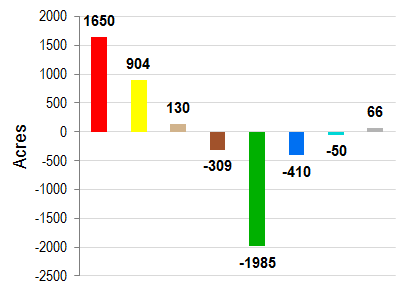
| Developed | 21429 | 25.4% | 23079 | 27.4% | 1650 | 2.0% |
| Turf & Grass | 9432 | 11.2% | 10336 | 12.3% | 904 | 1.1% |
| Other Grass | 783 | 0.9% | 913 | 1.1% | 130 | 0.2% |
| Ag. Field | 816 | 1.0% | 506 | 0.6% | -309 | -0.4% |
| Deciduous Forest | 39987 | 47.5% | 38533 | 45.8% | -1454 | -1.7% |
| Coniferous Forest | 4167 | 4.9% | 3995 | 4.7% | -172 | -0.2% |
| Water | 2165 | 2.6% | 1755 | 2.1% | -410 | -0.5% |
| Non-forested Wetlands | 180 | 0.2% | 179 | 0.2% | 0 | 0.0% |
| Forested Wetlands | 4387 | 5.2% | 4030 | 4.8% | -357 | -0.4% |
| Tidal Wetlands | 352 | 0.4% | 302 | 0.4% | -50 | -0.1% |
| Barren | 403 | 0.5% | 469 | 0.6% | 66 | 0.1% |
| Utility ROW (Forest) | 113 | 0.1% | 110 | 0.1% | -3 | 0.0% |
Change in Riparian Zone Land Cover, 1985-2010 |
||
 |
|
|
| Developed | ||
| Turf & Grass | ||
| Other Grass | ||
| Agricultural Field | ||
| Forest | ||
| Water | ||
| Wetland | ||
| Barren | ||
| 1985 | 1990 | 1995 | 2002 | 2006 | 2010 | Change | |||||||
| acres | % | acres | % |
acres | % | acres | % | acres | % | acres | % | acres | % |
| 34345 | 5.1% | 35026 | 5.2% | 35361 | 5.3% | 35767 | 5.3% | 36079 | 5.4% | 36391 | 5.4% | 2046 | 0.3% |