College of Agriculture and Natural Resources
Center for Land Use Education and Research

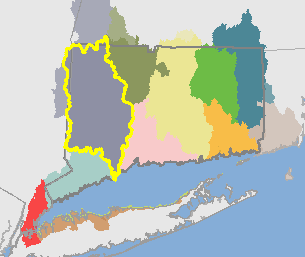 Housatonic Basin (01100005)
The Housatonic Basin is approximately 1950 square miles (1,248,001 acres). Of the total area, 66% (1288 square miles, 824,513 acres) is covered by the land cover data and included in the statistics below.
It includes the following HUC12 basins: Bantam River, Blackberry River, Bladens River-Naugatuck River, Branch Brook, Candlewood Lake, Carse Brook-Housatonic River, East Aspetuck River, East Branch Naugatuck River, Eightmile Brook, Farmill River, Furnace Brook-Housatonic River, Great Brook-Housatonic River, Halfway River-Housatonic River, Hancock Brook, Headwaters Shepaug River, Headwaters Still River, Headwaters Webatuck Creek, Hollenbeck River, Hop Brook, Housatonic River-Frontal Long Island Sound, Leadmine Brook, Limekiln Brook-Still River, Little River, Long Meadow Pond Brook-Naugatuck River, Macedonia Brook, Mad River, Mudge Pond Brook, Nonewaug River, Northfield Brook-Naugatuck River, Outlet Shepaug River, Outlet Still River, Outlet Webatuck Creek, Pomperaug River, Pootatuck River, Salmon Creek, Steele Brook, Weekeepeemee River, West Aspetuck River, West Branch Naugatuck River and Whiting River.
Visit the Interactive Map to see and compare the maps. Visit the Statistics or Maps page to see the breakdown for the HUC12 basins.
| 1985 | 2010 | Change | ||||
| acres | % | acres | % |
acres | % | |
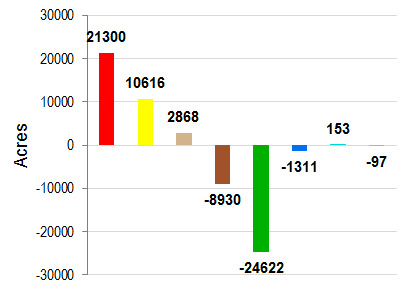
| Developed | 102676 | 12.8% | 123977 | 15.4% | 21300 | 2.6% |
| Turf & Grass | 39815 | 5.0% | 50431 | 6.3% | 10616 | 1.3% |
| Other Grass | 8372 | 1.0% | 11240 | 1.4% | 2868 | 0.4% |
| Ag. Field | 83411 | 10.4% | 74481 | 9.3% | -8930 | -1.1% |
| Deciduous Forest | 422740 | 52.6% | 401057 | 49.9% | -21683 | -2.7% |
| Coniferous Forest | 84400 | 10.5% | 82621 | 10.3% | -1779 | -0.2% |
| Water | 29921 | 3.7% | 28609 | 3.6% | -1311 | -0.2% |
| Non-forested Wetlands | 2793 | 0.3% | 2970 | 0.4% | 178 | 0.0% |
| Forested Wetlands | 22607 | 2.8% | 21454 | 2.7% | -1153 | -0.1% |
| Tidal Wetlands | 407 | 0.1% | 383 | 0.0% | -25 | 0.0% |
| Barren | 4533 | 0.6% | 4436 | 0.6% | -97 | 0.0% |
| Utility ROW (Forest) | 2383 | 0.3% | 2375 | 0.3% | -8 | 0.0% |
Change in Zone Land Cover, 1985-2010 |
||
 |
|
|
| Developed | ||
| Turf & Grass | ||
| Other Grass | ||
| Agricultural Field | ||
| Forest | ||
| Water | ||
| Wetland | ||
| Barren | ||
| 1985 | 2010 | Change | ||||
| acres | % | acres | % | acres | % | |
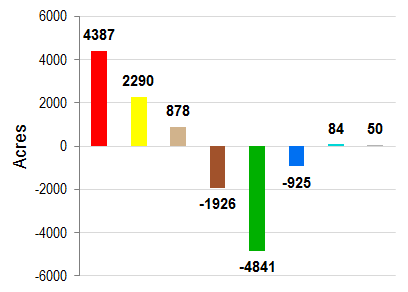
| Developed | 28284 | 13.8% | 32671 | 15.9% | 4387 | 2.1% |
| Turf & Grass | 9056 | 4.4% | 11346 | 5.5% | 2290 | 1.1% |
| Other Grass | 2326 | 1.1% | 3204 | 1.6% | 878 | 0.4% |
| Ag. Field | 18341 | 8.9% | 16416 | 8.0% | -1926 | -0.9% |
| Deciduous Forest | 102102 | 49.8% | 98220 | 47.9% | -3882 | -1.9% |
| Coniferous Forest | 23760 | 11.6% | 23397 | 11.4% | -363 | -0.2% |
| Water | 6405 | 3.1% | 5480 | 2.7% | -925 | -0.5% |
| Non-forested Wetlands | 1715 | 0.8% | 1807 | 0.9% | 92 | 0.0% |
| Forested Wetlands | 11353 | 5.5% | 10757 | 5.2% | -595 | -0.3% |
| Tidal Wetlands | 51 | 0.0% | 43 | 0.0% | -8 | 0.0% |
| Barren | 1208 | 0.6% | 1259 | 0.6% | 50 | 0.0% |
| Utility ROW (Forest) | 596 | 0.3% | 596 | 0.3% | 0 | 0.0% |
Change in Riparian Zone Land Cover, 1985-2010 |
||
 |
|
|
| Developed | ||
| Turf & Grass | ||
| Other Grass | ||
| Agricultural Field | ||
| Forest | ||
| Water | ||
| Wetland | ||
| Barren | ||
| 1985 | 1990 | 1995 | 2002 | 2006 | 2010 | Change | |||||||
| acres | % | acres | % |
acres | % | acres | % | acres | % | acres | % | acres | % |
| 44256 | 6.6% | 46456 | 6.9% | 47206 | 7.0% | 48427 | 7.2% | 49320 | 7.3% | 49661 | 7.4% | 5405 | 0.8% |