College of Agriculture and Natural Resources
Center for Land Use Education and Research

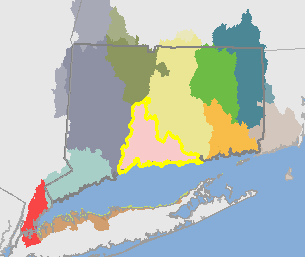 Quinnipiac Basin (01100004)
The Quinnipiac Basin is approximately 512 square miles (327,897 acres). It covers Central Connecticut from Massachusetts to the Connecticut River outlet to Long Island Sound.
It includes the following HUC12 basins: Branford River, Cove River-Frontal Long Island Sound, East River-Frontal Guilford Harbor, Eightmile River, Farm River, Hammonasset River-Frontal Clinton Harbor, Headwaters Quinnipiac River, Indian River-Frontal Long Island Sound, Menunketesuck River, Milford Harbor-Frontal Long Island Sound, Mill River, Muddy River, Outlet Quinnipiac River, Patchogue River-Frontal Westbrook Harbor, Tenmile River, West River, and West River-Frontal Guilford Harbor.
Visit the Interactive Map to see and compare the maps. Visit the Statistics or Maps page to see the breakdown for the HUC12 basins.
| 1985 | 2010 | Change | ||||
| acres | % | acres | % |
acres | % | |
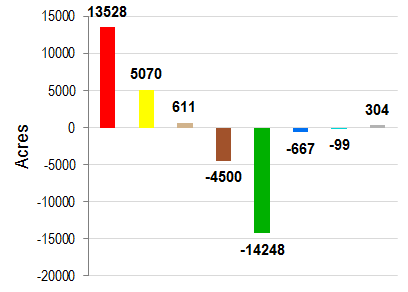
| Developed | 84353 | 25.7% | 97881 | 29.9% | 13528 | 4.1% |
| Turf & Grass | 30521 | 9.3% | 35591 | 10.9% | 5070 | 1.5% |
| Other Grass | 5766 | 1.8% | 6377 | 1.9% | 611 | 0.2% |
| Ag. Field | 16512 | 5.0% | 12012 | 3.7% | -4500 | -1.4% |
| Deciduous Forest | 146625 | 44.7% | 133851 | 40.8% | -12774 | -3.9% |
| Coniferous Forest | 9543 | 2.9% | 9078 | 2.8% | -464 | -0.1% |
| Water | 8367 | 2.6% | 7701 | 2.3% | -667 | -0.2% |
| Non-forested Wetlands | 1054 | 0.3% | 1111 | 0.3% | 57 | 0.0% |
| Forested Wetlands | 12718 | 3.9% | 11766 | 3.6% | -952 | -0.3% |
| Tidal Wetlands | 7107 | 2.2% | 6952 | 2.1% | -156 | 0.0% |
| Barren | 4110 | 1.3% | 4414 | 1.3% | 304 | 0.1% |
| Utility ROW (Forest) | 1221 | 0.4% | 1163 | 0.4% | -58 | 0.0% |
Change in Zone Land Cover, 1985-2010 |
||
 |
|
|
| Developed | ||
| Turf & Grass | ||
| Other Grass | ||
| Agricultural Field | ||
| Forest | ||
| Water | ||
| Wetland | ||
| Barren | ||
| 1985 | 2010 | Change | ||||
| acres | % | acres | % | acres | % | |
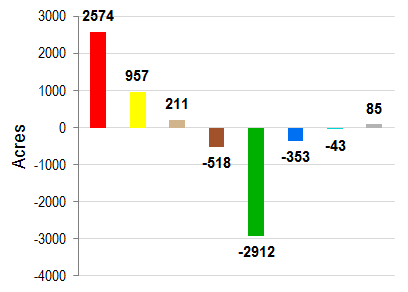
| Developed | 17254 | 20.9% | 19828 | 24.1% | 2574 | 3.1% |
| Turf & Grass | 5925 | 7.2% | 6882 | 8.4% | 957 | 1.2% |
| Other Grass | 1315 | 1.6% | 1525 | 1.9% | 211 | 0.3% |
| Ag. Field | 3212 | 3.9% | 2694 | 3.3% | -518 | -0.6% |
| Deciduous Forest | 40097 | 48.7% | 37727 | 45.8% | -2371 | -2.9% |
| Coniferous Forest | 3162 | 3.8% | 3048 | 3.7% | -115 | -0.1% |
| Water | 1839 | 2.2% | 1486 | 1.8% | -353 | -0.4% |
| Non-forested Wetlands | 510 | 0.6% | 519 | 0.6% | 9 | 0.0% |
| Forested Wetlands | 6344 | 7.7% | 5925 | 7.2% | -419 | -0.5% |
| Tidal Wetlands | 1598 | 1.9% | 1546 | 1.9% | -52 | -0.1% |
| Barren | 801 | 1.0% | 886 | 1.1% | 85 | 0.1% |
| Utility ROW (Forest) | 340 | 0.4% | 332 | 0.4% | -8 | 0.0% |
Change in Riparian Zone Land Cover, 1985-2010 |
||
 |
|
|
| Developed | ||
| Turf & Grass | ||
| Other Grass | ||
| Agricultural Field | ||
| Forest | ||
| Water | ||
| Wetland | ||
| Barren | ||
| 1985 | 1990 | 1995 | 2002 | 2006 | 2010 | Change | |||||||
| acres | % | acres | % |
acres | % | acres | % | acres | % | acres | % | acres | % |
| 33127 | 4.9% | 34514 | 5.1% | 35103 | 5.2% | 35925 | 5.3% | 36375 | 5.4% | 36567 | 5.4% | 3440 | 0.5% |