College of Agriculture and Natural Resources
Center for Land Use Education and Research

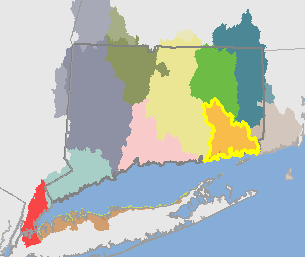 Thames Basin (01100003)
The Saugatuck River Basin is approximately 369 square miles (236,102 acres).
It includes the following HUC12 basins: Deep River, Fenger Brook-Frontal Lond Island Sound, Mystic River-Frontal Fishers Island Sound, Niantic River, Pattagansett River-Frontal Long Island Sound, Pease Brook-Yantic River, Poquetanuck Brook, Poquonock River-Frontal Fishers Island Sound, Stony Brook, Stony Brook-Frontal Fishers Island Sound, Susquetonscut Brook, and Thames River-Frontal New London Harbor.
Visit the Interactive Map to see and compare the maps. Visit the Statistics or Maps page to see the breakdown for the HUC12 basins.
| 1985 | 2010 | Change | ||||
| acres | % | acres | % |
acres | % | |
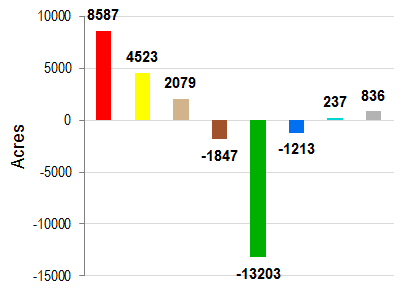
| Developed | 32935 | 13.9% | 41522 | 17.6% | 8587 | 3.6% |
| Turf & Grass | 10470 | 4.4% | 14993 | 6.4% | 4523 | 1.9% |
| Other Grass | 3700 | 1.6% | 5779 | 2.4% | 2079 | 0.9% |
| Ag. Field | 18195 | 7.7% | 16348 | 6.9% | -1847 | -0.8% |
| Deciduous Forest | 132001 | 55.9% | 120060 | 50.9% | -11940 | -5.1% |
| Coniferous Forest | 8326 | 3.5% | 7591 | 3.2% | -735 | -0.3% |
| Water | 11659 | 4.9% | 10446 | 4.4% | -1213 | -0.5% |
| Non-forested Wetlands | 1010 | 0.4% | 1051 | 0.4% | 41 | 0.0% |
| Forested Wetlands | 12859 | 5.4% | 12402 | 5.3% | -457 | -0.2% |
| Tidal Wetlands | 1442 | 0.6% | 1638 | 0.7% | 196 | 0.1% |
| Barren | 1820 | 0.8% | 2656 | 1.1% | 836 | 0.4% |
| Utility ROW (Forest) | 1685 | 0.7% | 1615 | 0.7% | -71 | 0.0% |
Change in Zone Land Cover, 1985-2010 |
||
 |
|
|
| Developed | ||
| Turf & Grass | ||
| Other Grass | ||
| Agricultural Field | ||
| Forest | ||
| Water | ||
| Wetland | ||
| Barren | ||
| 1985 | 2010 | Change | ||||
| acres | % | acres | % | acres | % | |
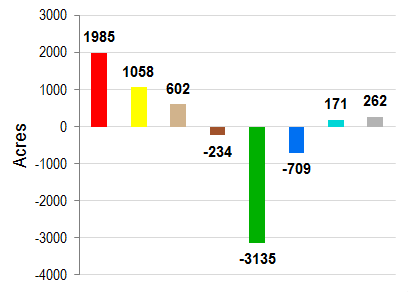
| Developed | 8649 | 12.3% | 10633 | 15.1% | 1985 | 2.8% |
| Turf & Grass | 2587 | 3.7% | 3645 | 5.2% | 1058 | 1.5% |
| Other Grass | 1040 | 1.5% | 1642 | 2.3% | 602 | 0.9% |
| Ag. Field | 4290 | 6.1% | 4056 | 5.8% | -234 | -0.3% |
| Deciduous Forest | 39215 | 55.7% | 36508 | 51.9% | -2708 | -3.8% |
| Coniferous Forest | 2654 | 3.8% | 2519 | 3.6% | -135 | -0.2% |
| Water | 2214 | 3.1% | 1505 | 2.1% | -709 | -1.0% |
| Non-forested Wetlands | 641 | 0.9% | 665 | 0.9% | 24 | 0.0% |
| Forested Wetlands | 7653 | 10.9% | 7374 | 10.5% | -278 | -0.4% |
| Tidal Wetlands | 377 | 0.5% | 524 | 0.7% | 148 | 0.2% |
| Barren | 581 | 0.8% | 843 | 1.2% | 262 | 0.4% |
| Utility ROW (Forest) | 476 | 0.7% | 462 | 0.7% | -14 | 0.0% |
Change in Riparian Zone Land Cover, 1985-2010 |
||
 |
|
|
| Developed | ||
| Turf & Grass | ||
| Other Grass | ||
| Agricultural Field | ||
| Forest | ||
| Water | ||
| Wetland | ||
| Barren | ||
| 1985 | 1990 | 1995 | 2002 | 2006 | 2010 | Change | |||||||
| acres | % | acres | % |
acres | % | acres | % | acres | % | acres | % | acres | % |
| 13296 | 2.0% | 13969 | 2.1% | 14398 | 2.1% | 15045 | 2.2% | 15333 | 2.3% | 15585 | 2.3% | 2289 | 0.3% |