College of Agriculture and Natural Resources
Center for Land Use Education and Research

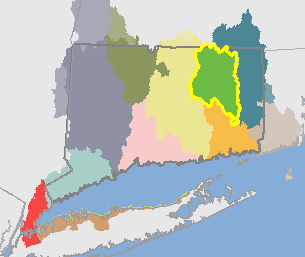 Shetucket Basin (01100002)
The Shetucket Basin is approximately 526 square miles (336,797 acres).
It includes the following HUC12 basins: Beaver Brook-Shetucket River, Bigelow Brook, Bungee Brook, Edson Brook, Fenton River, Furnace Brook, Hop River, Little River, Merrick Brook, Middle River, Mount Hope River, Nelson Brook-Willimantic River, Roaring Brook, Sawmill Brook-Natchaug River, Skungamaug River, Still River, and Tenmile River.
Visit the Interactive Map to see and compare the maps. Visit the Statistics or Maps page to see the breakdown for the HUC12 basins.
| 1985 | 2010 | Change | ||||
| acres | % | acres | % |
acres | % | |
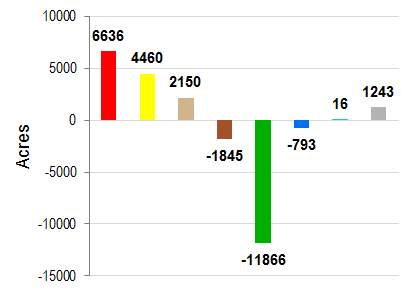
| Developed | 29159 | 8.7% | 35794 | 10.6% | 6636 | 2.0% |
| Turf & Grass | 9255 | 2.7% | 13715 | 4.1% | 4460 | 1.3% |
| Other Grass | 3630 | 1.1% | 5780 | 1.7% | 2150 | 0.6% |
| Ag. Field | 27553 | 8.2% | 25708 | 7.6% | -1845 | -0.5% |
| Deciduous Forest | 204182 | 60.6% | 193908 | 57.6% | -10274 | -3.1% |
| Coniferous Forest | 36979 | 11.0% | 35937 | 10.7% | -1042 | -0.3% |
| Water | 9679 | 2.9% | 8885 | 2.6% | -793 | -0.2% |
| Non-forested Wetlands | 1606 | 0.5% | 1622 | 0.5% | 16 | 0.0% |
| Forested Wetlands | 12505 | 3.7% | 11984 | 3.6% | -521 | -0.2% |
| Tidal Wetlands | 0 | 0.0% | 0 | 0.0% | 0 | 0.0% |
| Barren | 1225 | 0.4% | 2469 | 0.7% | 1243 | 0.4% |
| Utility ROW (Forest) | 1024 | 0.3% | 995 | 0.3% | -29 | 0.0% |
Change in Zone Land Cover, 1985-2010 |
||
 |
|
|
| Developed | ||
| Turf & Grass | ||
| Other Grass | ||
| Agricultural Field | ||
| Forest | ||
| Water | ||
| Wetland | ||
| Barren | ||
| 1985 | 2010 | Change | ||||
| acres | % | acres | % | acres | % | |
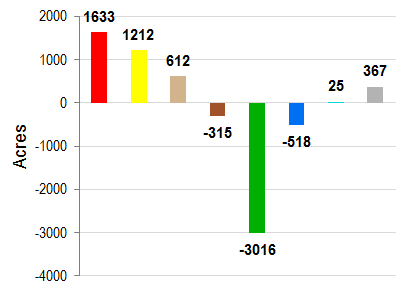
| Developed | 8957 | 8.8% | 10590 | 10.5% | 1633 | 1.6% |
| Turf & Grass | 2560 | 2.5% | 3772 | 3.7% | 1212 | 1.2% |
| Other Grass | 1087 | 1.1% | 1699 | 1.7% | 612 | 0.6% |
| Ag. Field | 7166 | 7.1% | 6851 | 6.8% | -315 | -0.3% |
| Deciduous Forest | 57365 | 56.6% | 54994 | 54.3% | -2370 | -2.3% |
| Coniferous Forest | 12032 | 11.9% | 11751 | 11.6% | -281 | -0.3% |
| Water | 3304 | 3.3% | 2786 | 2.7% | -518 | -0.5% |
| Non-forested Wetlands | 875 | 0.9% | 900 | 0.9% | 25 | 0.0% |
| Forested Wetlands | 7401 | 7.3% | 7044 | 7.0% | -357 | -0.4% |
| Tidal Wetlands | 0 | 0.0% | 0 | 0.0% | 0 | 0.0% |
| Barren | 332 | 0.3% | 698 | 0.7% | 367 | 0.4% |
| Utility ROW (Forest) | 252 | 0.2% | 245 | 0.2% | -7 | 0.0% |
Change in Riparian Zone Land Cover, 1985-2010 |
||
 |
|
|
| Developed | ||
| Turf & Grass | ||
| Other Grass | ||
| Agricultural Field | ||
| Forest | ||
| Water | ||
| Wetland | ||
| Barren | ||
| 1985 | 1990 | 1995 | 2002 | 2006 | 2010 | Change | |||||||
| acres | % | acres | % |
acres | % | acres | % | acres | % | acres | % | acres | % |
| 12596 | 1.9% | 13216 | 2.0% | 13616 | 2.0% | 14029 | 2.1% | 14263 | 2.1% | 14370 | 2.1% | 1774 | 0.3% |