College of Agriculture and Natural Resources
Center for Land Use Education and Research

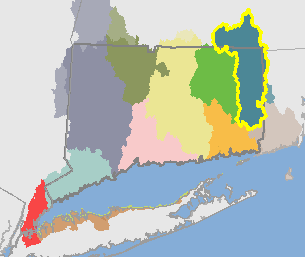 Quinebaug Basin (01100001)
The Quinebaug River Basin is approximately 704 square miles (450,397 acres). It covers the northeastern corner of Connecticut and parts of Massachusetts adn Rhode Island.
It includes the following HUC12 basins: Blackwell Brook, Broad Brook, Cady Brook-Quinebaug River, Cory Brook-Quinebaug River, Fall Brook-Quinebaug River, Headwaters Quinebaug River, Little River, Little River, Lower Fivemile River, Lower French River, Lower Moosup River, Lower Pachaug River, Mashamoquet River, Mashapaug Pond, McKinstry Brook-Quinebaug River, Middle French River, Mill Brook, Quaduck Brook, Shunway Brook-Quinebaug River, Upper Fivemile River, Upper French River, and Upper Pachaug River.
Visit the Interactive Map to see and compare the maps. Visit the Statistics or Maps page to see the breakdown for the HUC12 basins.
| 1985 | 2010 | Change | ||||
| acres | % | acres | % |
acres | % | |
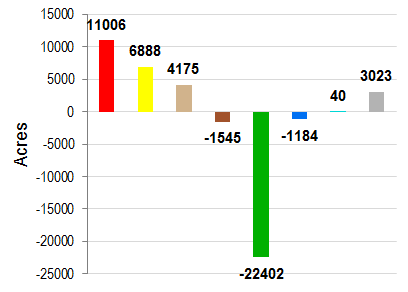
| Developed | 40273 | 8.9% | 51279 | 11.4% | 11006 | 2.4% |
| Turf & Grass | 12538 | 2.8% | 19426 | 4.3% | 6888 | 1.5% |
| Other Grass | 3975 | 0.9% | 8149 | 1.8% | 4175 | 0.9% |
| Ag. Field | 41936 | 9.3% | 40390 | 9.0% | -1545 | -0.3% |
| Deciduous Forest | 236565 | 52.5% | 218564 | 48.5% | -18001 | -4.0% |
| Coniferous Forest | 63588 | 14.1% | 60397 | 13.4% | -3191 | -0.7% |
| Water | 18175 | 4.0% | 16991 | 3.8% | -1184 | -0.3% |
| Non-forested Wetlands | 4149 | 0.9% | 4189 | 0.9% | 40 | 0.0% |
| Forested Wetlands | 25553 | 5.7% | 24427 | 5.4% | -1126 | -0.3% |
| Tidal Wetlands | 0 | 0.0% | 0 | 0.0% | 0 | 0.0% |
| Barren | 1870 | 0.4% | 4893 | 1.1% | 3023 | 0.7% |
| Utility ROW (Forest) | 1619 | 0.4% | 1535 | 0.3% | -84 | 0.0% |
Change in Zone Land Cover, 1985-2010 |
||
 |
|
|
| Developed | ||
| Turf & Grass | ||
| Other Grass | ||
| Agricultural Field | ||
| Forest | ||
| Water | ||
| Wetland | ||
| Barren | ||
| 1985 | 2010 | Change | ||||
| acres | % | acres | % | acres | % | |
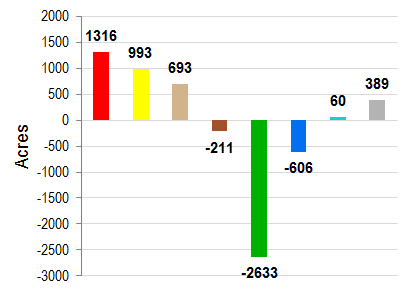
| Developed | 6022 | 8.0% | 7338 | 9.8% | 1316 | 1.8% |
| Turf & Grass | 2068 | 2.8% | 3061 | 4.1% | 993 | 1.3% |
| Other Grass | 814 | 1.1% | 1507 | 2.0% | 693 | 0.9% |
| Ag. Field | 7097 | 9.4% | 6886 | 9.2% | -211 | -0.3% |
| Deciduous Forest | 36590 | 48.7% | 34574 | 46.0% | -2016 | -2.7% |
| Coniferous Forest | 9365 | 12.5% | 9042 | 12.0% | -324 | -0.4% |
| Water | 3069 | 4.1% | 2463 | 3.3% | -606 | -0.8% |
| Non-forested Wetlands | 1389 | 1.8% | 1448 | 1.9% | 60 | 0.1% |
| Forested Wetlands | 8279 | 11.0% | 7997 | 10.6% | -282 | -0.4% |
| Tidal Wetlands | 0 | 0.0% | 0 | 0.0% | 0 | 0.0% |
| Barren | 197 | 0.3% | 586 | 0.8% | 389 | 0.5% |
| Utility ROW (Forest) | 212 | 0.3% | 201 | 0.3% | -11 | 0.0% |
Change in Riparian Zone Land Cover, 1985-2010 |
||
 |
|
|
| Developed | ||
| Turf & Grass | ||
| Other Grass | ||
| Agricultural Field | ||
| Forest | ||
| Water | ||
| Wetland | ||
| Barren | ||
| 1985 | 1990 | 1995 | 2002 | 2006 | 2010 | Change | |||||||
| acres | % | acres | % |
acres | % | acres | % | acres | % | acres | % | acres | % |
| 16976 | 2.5% | 18129 | 2.7% | 18735 | 2.8% | 19492 | 2.9% | 19871 | 3.0% | 20008 | 3.0% | 3032 | 0.5% |