College of Agriculture and Natural Resources
Center for Land Use Education and Research

 Pawcatuck-Wood Basin (01090005)
The Pawcatuck-Wood Basin is approximately 369 square miles (236,117 acres). Of the total area, only 16% (60 square miles, 38,568 acres) is covered by the land cover data and included in the statistics below.
It includes the following HUC12 basins: Ashaway River, Lower Pawcatuck River and Shunock River.
Visit the Interactive Map to see and compare the maps. Visit the Statistics or Maps page to see the breakdown for the HUC12 basins.
| 1985 | 2010 | Change | ||||
| acres | % | acres | % |
acres | % | |
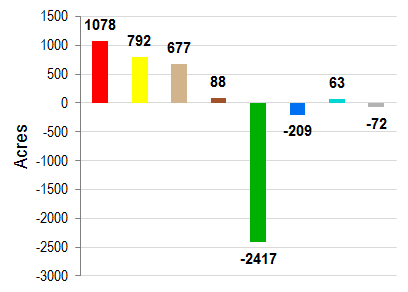
| Developed | 4412 | 11.5% | 5490 | 14.3% | 1078 | 2.8% |
| Turf & Grass | 1236 | 3.2% | 2029 | 5.3% | 792 | 2.1% |
| Other Grass | 834 | 2.2% | 1511 | 3.9% | 677 | 1.8% |
| Ag. Field | 3039 | 7.9% | 3127 | 8.1% | 88 | 0.2% |
| Deciduous Forest | 24059 | 62.5% | 21633 | 56.2% | -2426 | -6.3% |
| Coniferous Forest | 1057 | 2.7% | 1044 | 2.7% | -13 | 0.0% |
| Water | 1381 | 3.6% | 1172 | 3.0% | -209 | -0.5% |
| Non-forested Wetlands | 415 | 1.1% | 426 | 1.1% | 10 | 0.0% |
| Forested Wetlands | 1461 | 3.8% | 1491 | 3.9% | 30 | 0.1% |
| Tidal Wetlands | 75 | 0.2% | 128 | 0.3% | 53 | 0.1% |
| Barren | 428 | 1.1% | 356 | 0.9% | -72 | -0.2% |
| Utility ROW (Forest) | 65 | 0.2% | 56 | 0.1% | -9 | 0.0% |
Change in Zone Land Cover, 1985-2010 |
||
 |
|
|
| Developed | ||
| Turf & Grass | ||
| Other Grass | ||
| Agricultural Field | ||
| Forest | ||
| Water | ||
| Wetland | ||
| Barren | ||
| 1985 | 2010 | Change | ||||
| acres | % | acres | % | acres | % | |
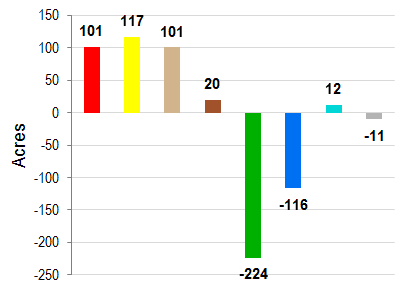
| Developed | 553 | 7.7% | 654 | 9.1% | 101 | 1.4% |
| Turf & Grass | 159 | 2.2% | 276 | 3.9% | 117 | 1.6% |
| Other Grass | 45 | 0.6% | 145 | 2.0% | 101 | 1.4% |
| Ag. Field | 510 | 7.1% | 530 | 7.4% | 20 | 0.3% |
| Deciduous Forest | 4473 | 62.6% | 4231 | 59.2% | -242 | -3.4% |
| Coniferous Forest | 282 | 3.9% | 282 | 3.9% | 1 | 0.0% |
| Water | 270 | 3.8% | 154 | 2.2% | -116 | -1.6% |
| Non-forested Wetlands | 177 | 2.5% | 180 | 2.5% | 2 | 0.0% |
| Forested Wetlands | 601 | 8.4% | 621 | 8.7% | 20 | 0.3% |
| Tidal Wetlands | 14 | 0.2% | 24 | 0.3% | 9 | 0.1% |
| Barren | 56 | 0.8% | 45 | 0.6% | -11 | -0.1% |
| Utility ROW (Forest) | 7 | 0.1% | 5 | 0.1% | -2 | 0.0% |
Change in Riparian Zone Land Cover, 1985-2010 |
||
 |
|
|
| Developed | ||
| Turf & Grass | ||
| Other Grass | ||
| Agricultural Field | ||
| Forest | ||
| Water | ||
| Wetland | ||
| Barren | ||
| 1985 | 1990 | 1995 | 2002 | 2006 | 2010 | Change | |||||||
| acres | % | acres | % |
acres | % | acres | % | acres | % | acres | % | acres | % |
| 1891 | 0.3% | 1968 | 0.3% | 2023 | 0.3% | 2159 | 0.3% | 2167 | 0.3% | 2198 | 0.3% | 307 | 0.0% |