College of Agriculture and Natural Resources
Center for Land Use Education and Research

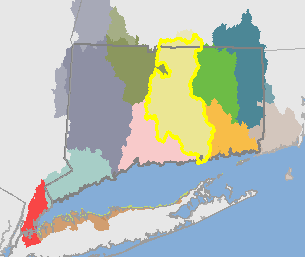 Lower Connecticut River Basin (01080205)
The Lower Connecticut River Basin is approximately 1050 square miles (672,595 acres). It covers Central Connecticut from Massachusetts to the Connecticut River outlet to Long Island Sound.
It includes the following HUC12 basins: Blackledge River, Broad Brook, Coginchaug River, Deep River-Connecticut River, Dickinson Creek-Salmon River, East Branch Eightmile River, Eightmile River, Falls River, Freshwater Brook-Connecticut River, Goff Brook-Connecticut River, Higganum Creek, Jeremy River, Joshua Creek-Connecticut River, Lower Hockanum River, Lower Mattabesset River, Lower Scantic River, Mill Creek-Connecticut River, Moodus River, Muddy Brook, North Branch Park River, Pecousic Brook-Connecticut River, Pine Brook, Piper Brook-Park River, Podunk River, Reservoir Brook-Connecticut River, Roaring Brook, Salmon Brook, Stony Brook, Stoughton Brook-Connecticut River, Trout Brook, Upper Hockanum River, Upper Mattabesset River, Upper Scantic River.
Visit the Interactive Map to see and compare the maps. Visit the Statistics or Maps page to see the breakdown for the HUC12 basins.
| 1985 | 2010 | Change | ||||
| acres | % | acres | % |
acres | % | |
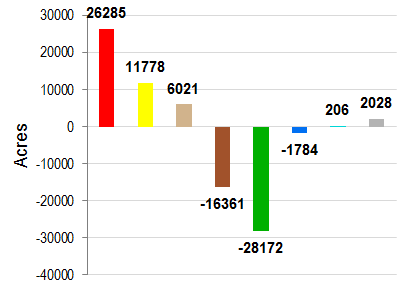
| Developed | 119020 | 18.0% | 145304 | 22.0% | 26285 | 4.0% |
| Turf & Grass | 48487 | 7.3% | 60266 | 9.1% | 11778 | 1.8% |
| Other Grass | 12737 | 1.9% | 18758 | 2.8% | 6021 | 0.9% |
| Ag. Field | 74355 | 11.3% | 57994 | 8.8% | -16361 | -2.5% |
| Deciduous Forest | 307300 | 46.5% | 282286 | 42.7% | -25014 | -3.8% |
| Coniferous Forest | 35439 | 5.4% | 33516 | 5.1% | -1923 | -0.3% |
| Water | 26965 | 4.1% | 25181 | 3.8% | -1784 | -0.3% |
| Non-forested Wetlands | 2175 | 0.3% | 2165 | 0.3% | -10 | 0.0% |
| Forested Wetlands | 23146 | 3.5% | 21983 | 3.3% | -1163 | -0.2% |
| Tidal Wetlands | 3901 | 0.6% | 4118 | 0.6% | 216 | 0.0% |
| Barren | 3971 | 0.6% | 5999 | 0.9% | 2028 | 0.3% |
| Utility ROW (Forest) | 3224 | 0.5% | 3152 | 0.5% | -72 | 0.0% |
Change in Zone Land Cover, 1985-2010 |
||
 |
|
|
| Developed | ||
| Turf & Grass | ||
| Other Grass | ||
| Agricultural Field | ||
| Forest | ||
| Water | ||
| Wetland | ||
| Barren | ||
| 1985 | 2010 | Change | ||||
| acres | % | acres | % | acres | % | |
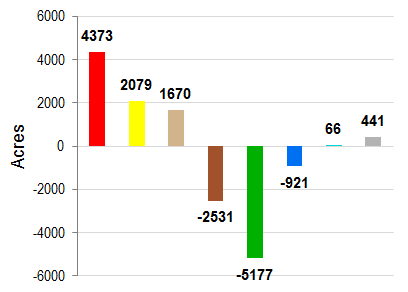
| Developed | 23064 | 14.8% | 27437 | 17.6% | 4373 | 2.8% |
| Turf & Grass | 9100 | 5.8% | 11180 | 7.2% | 2079 | 1.3% |
| Other Grass | 2647 | 1.7% | 4317 | 2.8% | 1670 | 1.1% |
| Ag. Field | 14498 | 9.3% | 11967 | 7.7% | -2531 | -1.6% |
| Deciduous Forest | 76421 | 49.0% | 72234 | 46.3% | -4187 | -2.7% |
| Coniferous Forest | 10745 | 6.9% | 10369 | 6.6% | -376 | -0.2% |
| Water | 4919 | 3.2% | 3998 | 2.6% | -921 | -0.6% |
| Non-forested Wetlands | 943 | 0.6% | 943 | 0.6% | 0 | 0.0% |
| Forested Wetlands | 11419 | 7.3% | 10819 | 6.9% | -600 | -0.4% |
| Tidal Wetlands | 650 | 0.4% | 716 | 0.5% | 66 | 0.0% |
| Barren | 856 | 0.5% | 1297 | 0.8% | 441 | 0.3% |
| Utility ROW (Forest) | 747 | 0.5% | 732 | 0.5% | -14 | 0.0% |
Change in Riparian Zone Land Cover, 1985-2010 |
||
 |
|
|
| Developed | ||
| Turf & Grass | ||
| Other Grass | ||
| Agricultural Field | ||
| Forest | ||
| Water | ||
| Wetland | ||
| Barren | ||
| 1985 | 1990 | 1995 | 2002 | 2006 | 2010 | Change | |||||||
| acres | % | acres | % |
acres | % | acres | % | acres | % | acres | % | acres | % |
| 48488 | 7.2% | 51131 | 7.6% | 52175 | 7.8% | 53913 | 8.0% | 54825 | 8.2% | 55244 | 8.2% | 6756 | 1.0% |