
College of Agriculture and Natural Resources
Center for Land Use Education and Research

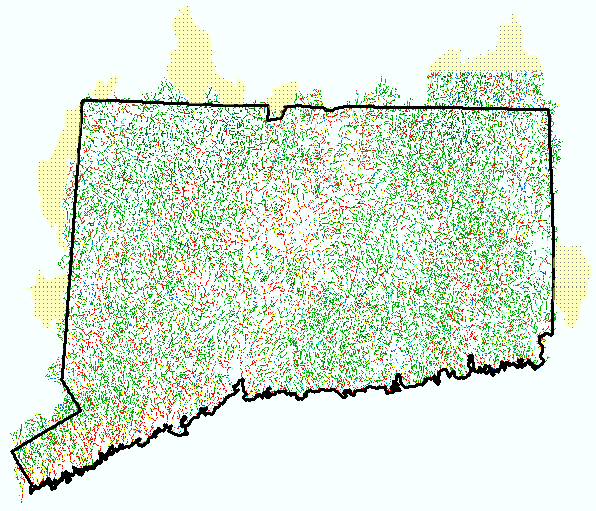
The riparian corridor study area consists of land on either side of streams and on the outside of waterbodies covering the entire state of Connecticut. For more information about how the buffer zones were created, see About the Project.
The study area crosses the Connectcut boundary in many places. Dotted areas are partial sub-regional basins that are not covered with riparian information.
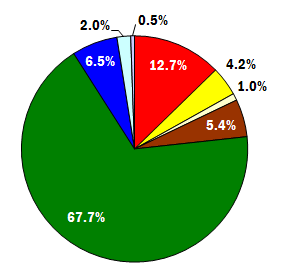
1985, 100 ft Riparian Zone |
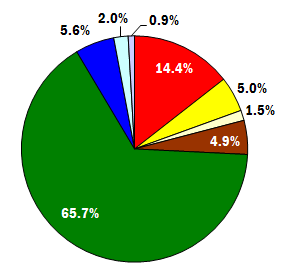
2006, 100 ft Riparian Zone |
 |
 |
| Developed | |
| Turf & Grass | |
| Other Grass | |
| Agricultural Field | |
| Forest | |
| Water | |
| Wetland | |
| Barren |
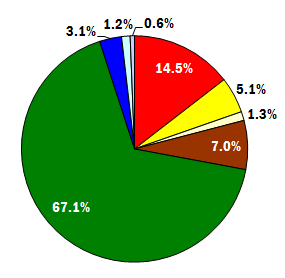
1985, 300 ft Riparian Zone |
2006, 300 ft Riparian Zone |
 |
 |
| Developed | |
| Turf & Grass | |
| Other Grass | |
| Agricultural Field | |
| Forest | |
| Water | |
| Wetland | |
| Barren |

| 1985 | 2006 | Change | |||||
| acres | % of 100ft zone | acres | % of 100ft zone | acres | change in % | % change* | |
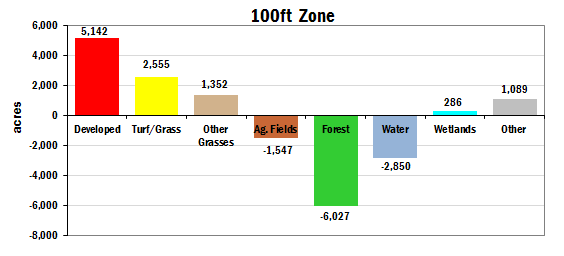
| Developed | 37902 | 12.7% | 43044 | 14.4% | 5142 | 1.7% | 14% |
| Turf/Grass | 12482 | 4.2% | 15037 | 5.0% | 2555 | 0.9% | 20% |
| Other Grasses | 2984 | 1.0% | 4336 | 1.5% | 1352 | 0.5% | 45% |
| Agricultural Fields | 16020 | 5.4% | 14473 | 4.9% | -1547 | -0.5% | -10% |
| Forest** | 201934 | 67.7% | 195907 | 65.7% | -6027 | -2.0% | -3% |
| Water | 19486 | 6.5% | 16637 | 5.6% | -2850 | -1.0% | -15% |
| Wetlands*** | 5825 | 2.0% | 6111 | 2.0% | 286 | 0.1% | 5% |
| Other**** | 1621 | 0.5% | 2710 | 0.9% | 1089 | 0.4% | 67% |
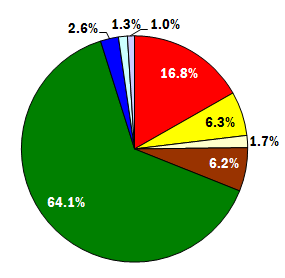
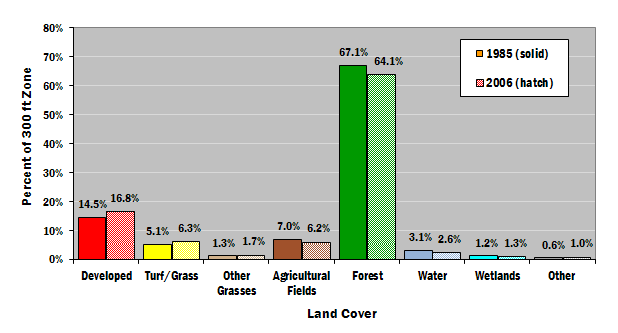
| 1985 | 2006 | Change | |||||
| acres | % of 300ft zone | acres | % of 300ft zone | acres | change in % | % change* | |
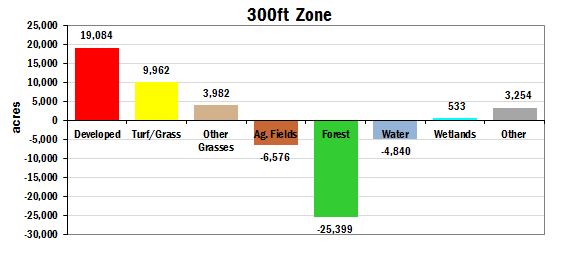
| Developed | 123293 | 14.5% | 142377 | 16.8% | 19084 | 2.2% | 15% |
| Turf/Grass | 43692 | 5.1% | 53654 | 6.3% | 9962 | 1.2% | 23% |
| Other Grasses | 10773 | 1.3% | 14755 | 1.7% | 3982 | 0.5% | 37% |
| Agricultural Fields | 59420 | 7.0% | 52844 | 6.2% | -6576 | -0.8% | -11% |
| Forest** | 569548 | 67.1% | 544149 | 64.1% | -25399 | -3.0% | -4% |
| Water | 26689 | 3.1% | 21849 | 2.6% | -4840 | -0.6% | -18% |
| Wetlands*** | 10344 | 1.2% | 10877 | 1.3% | 533 | 0.1% | 5% |
| Other**** | 5297 | 0.6% | 8551 | 1.0% | 3254 | 0.4% | 61% |

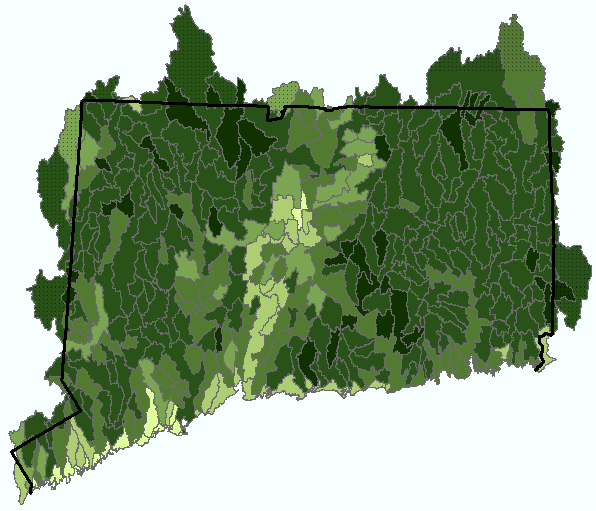
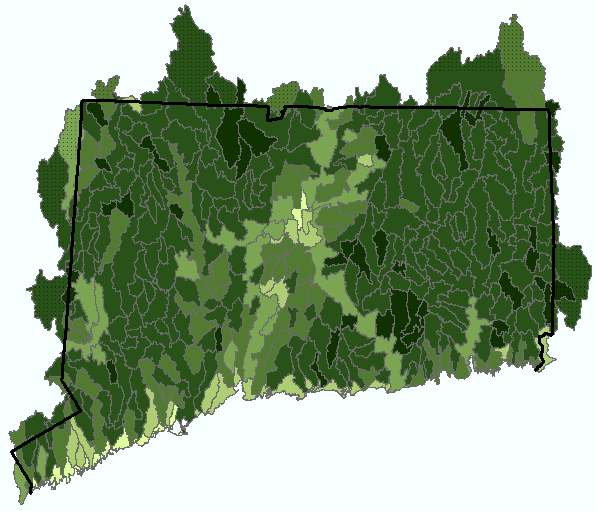
Each sub-regional basin is colored based on the percent of the 300 riparian zone that was forested* land cover in 1985.
| 2% to 20% | |
| 21% to 40% | |
| 41% to 50% | |
| 51% to 60% | |
| 61% to 80% | |
| 81% to 97% | |
| Area not covered by land cover. Only the portion of the basin covered by land cover in the riparian areas was included in the percent. |
Each sub-regional basin is colored based on the percent of the 300 riparian zone that was forested* land cover in 2006.
| 2% to 20% | |
| 21% to 40% | |
| 41% to 50% | |
| 51% to 60% | |
| 61% to 80% | |
| 81% to 97% | |
| Area not covered by land cover. Only the portion of the basin covered by land cover in the riparian areas was included in the percent. |
Forest is a combination of the deciduous forest, coniferous forest, forested wetland and utility right-of-way land cover classes.
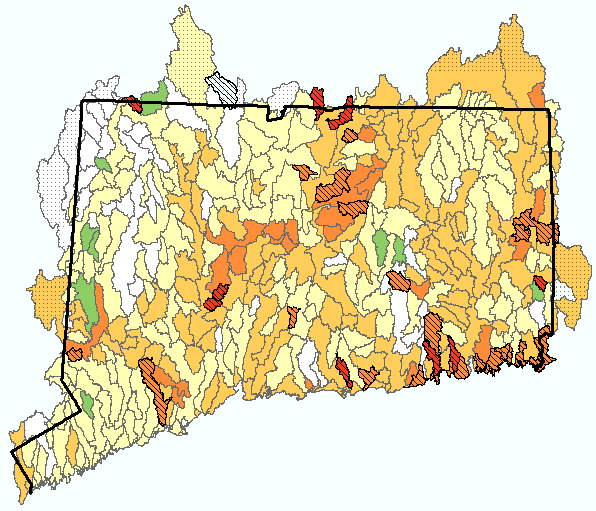
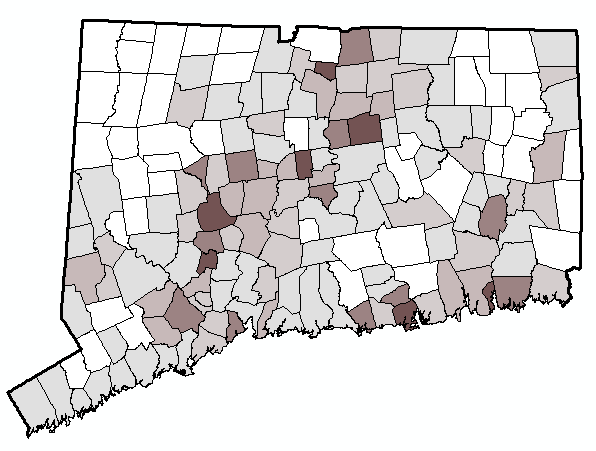
Each sub-regional basin is colored based on the change in percent of the forested* area in the 300 ft riparian zone.
Forest is a combination of the deciduous forest, coniferous forest, forested wetland and utility right-of-way land cover classes.

Each sub-regional basin is colored based on the percent of the 100 ft riparian zone that was forested* land cover in 1985.
| 2% to 20% | |
| 21% to 40% | |
| 41% to 50% | |
| 51% to 60% | |
| 61% to 80% | |
| 81% to 97% | |
| Area not covered by land cover. Only the portion of the basin covered by land cover in the riparian areas was included in the percent. |
Forest is a combination of the deciduous forest, coniferous forest, forested wetland and utility right-of-way land cover classes.
Each sub-regional basin is colored based on the percent of the 100 ft riparian zone that was forested* land cover in 2006.
| 2% to 20% | |
| 21% to 40% | |
| 41% to 50% | |
| 51% to 60% | |
| 61% to 80% | |
| 81% to 97% | |
| Area not covered by land cover. Only the portion of the basin covered by land cover in the riparian areas was included in the percent. |
Forest is a combination of the deciduous forest, coniferous forest, forested wetland and utility right-of-way land cover classes.
Each sub-regional basin is colored based on the change in percent of the forested* area in the 100 ft riparian zone.
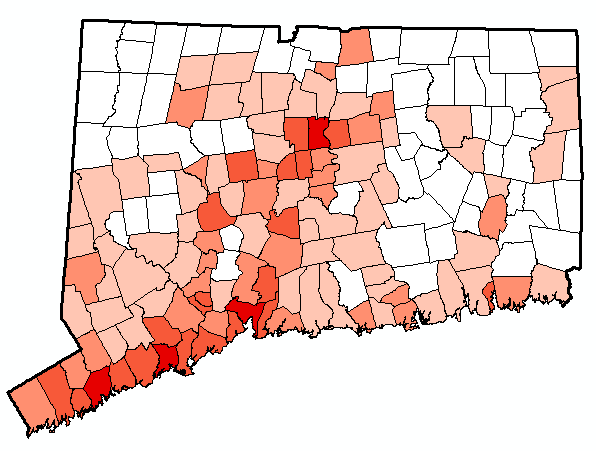
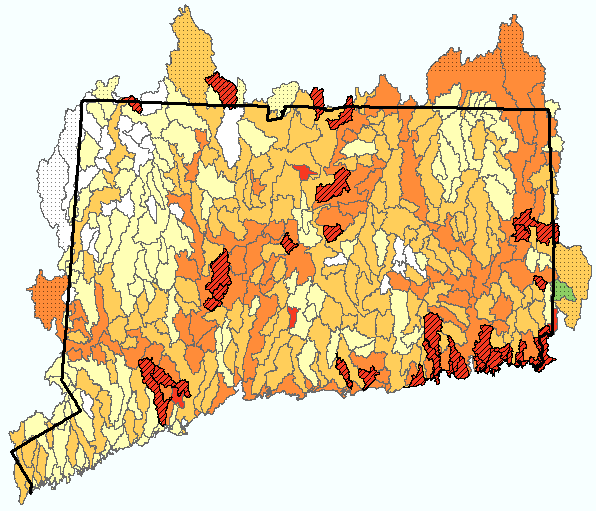
Each municipality is colored based on the percent of the 300 ft riparian zone that was developed land cover in 1985.
| 4% to10% | |
| 11% to 20% | |
| 21% to 30% | |
| 31% to 50% | |
| 51% to 71% |
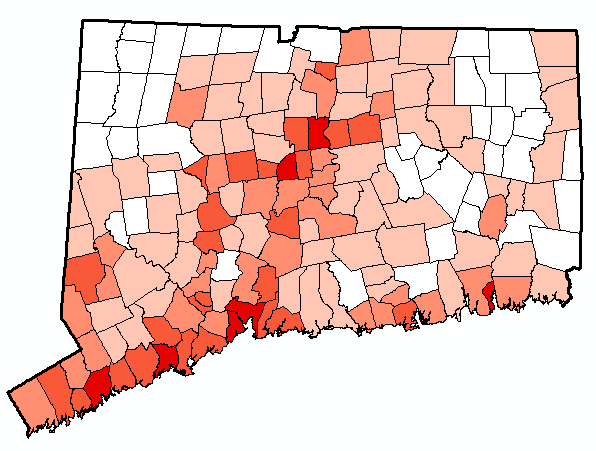
Each municipality is colored based on the percent of the 300 ft riparian zone that was developed land cover in 2006.
| 4% to10% | |
| 11% to 20% | |
| 21% to 30% | |
| 31% to 50% | |
| 51% to 71% |
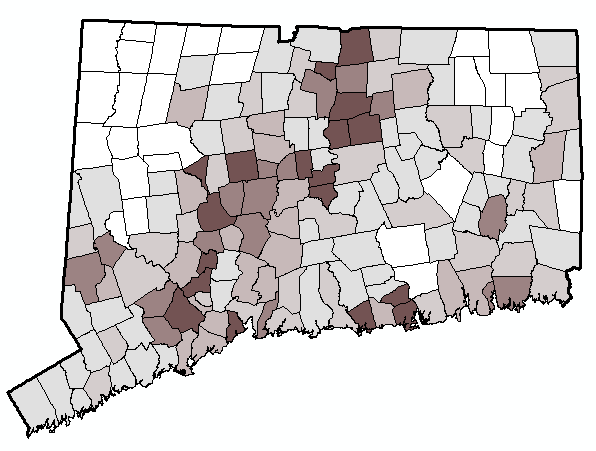
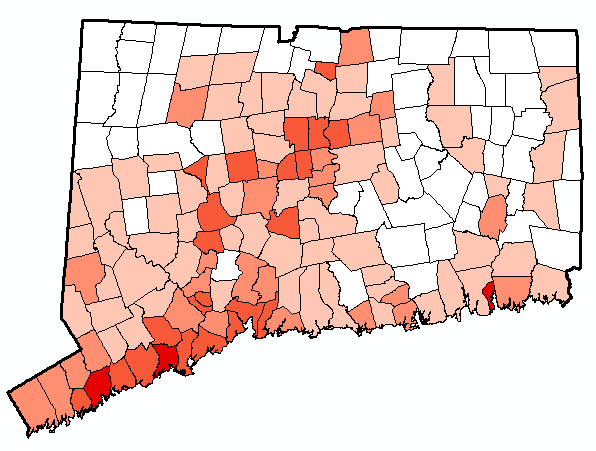
Each municipality is colored based on the change in percent of the developed class in the 300 ft riparian zone.
| 0% to 1% | |
| 1.1% to 2% | |
| 2.1% to 3% | |
| 3.1% to 4% | |
| 4.1% to 9% |
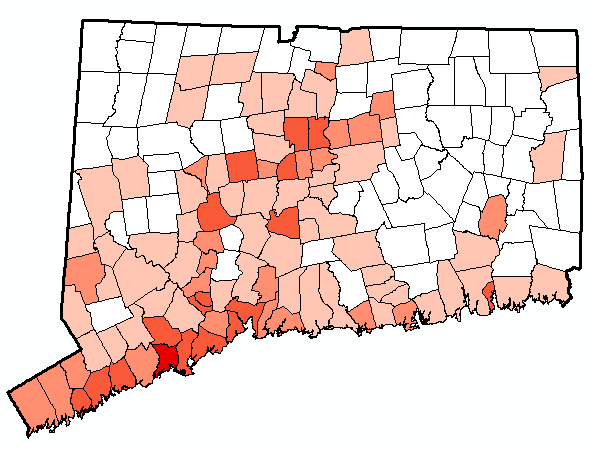
Each municipality is colored based on the percent of the 100 ft riparian zone that was developed land cover in 1985.
| 4% to10% | |
| 11% to 20% | |
| 21% to 30% | |
| 31% to 50% | |
| 51% to 71% |
Each municipality is colored based on the percent of the 100 ft riparian zone that was developed land cover in 2006.
| 4% to10% | |
| 11% to 20% | |
| 21% to 30% | |
| 31% to 50% | |
| 51% to 71% |
Each municipality is colored based on the change in percent of the developed class in the 100 ft riparian zone.
| 0% to 1% | |
| 1.1% to 2% | |
| 2.1% to 3% | |
| 3.1% to 4% | |
| 4.1% to 7% |