College of Agriculture and Natural Resources
Center for Land Use Education and Research

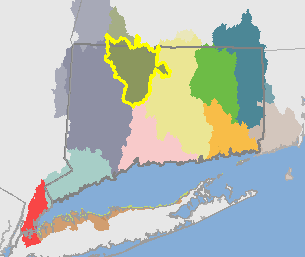 Farmington Basin (01080207)
The Farmington Basin is approximately 607 square miles (388,321 acres). Of the total area, 81% (495 square miles, 316,734 acres) is covered by the land cover data.
It includes the following HUC12 basins: Cherry Brook-Farmington River, Lower West Branch Farmington River, Mad River, Mill Brook-Farmington River, Mine Brook, Nepaug River, Nod Brook-Farmington River, Pequabuck River, Roaring Brook-Farmington River, Salmon Brook, Sandy Brook, Still River, Valley Brook-East Branch Farmington and West Branch Salmon Brook.
Visit the Interactive Map to see and compare the maps. Visit the Statistics or Maps page to see the breakdown for the HUC12 basins.
| 1985 | 2010 | Change | ||||
| acres | % | acres | % |
acres | % | |
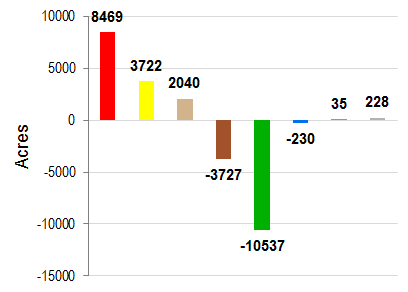
| Developed | 35822 | 11.7% | 44291 | 14.5% | 8469 | 2.8% |
| Turf & Grass | 14189 | 4.6% | 17911 | 5.9% | 3722 | 1.2% |
| Other Grass | 3607 | 1.2% | 5647 | 1.8% | 2040 | 0.7% |
| Ag. Field | 19743 | 6.5% | 16017 | 5.2% | -3727 | -1.2% |
| Deciduous Forest | 124399 | 40.7% | 116941 | 38.3% | -7458 | -2.4% |
| Coniferous Forest | 83283 | 27.2% | 81092 | 26.5% | -2191 | -0.7% |
| Water | 10457 | 3.4% | 10227 | 3.3% | -230 | -0.1% |
| Non-forested Wetlands | 1218 | 0.4% | 1253 | 0.4% | 35 | 0.0% |
| Forested Wetlands | 10120 | 3.3% | 9258 | 3.0% | -862 | -0.3% |
| Tidal Wetlands | 0 | 0.0% | 0 | 0.0% | 0 | 0.0% |
| Barren | 2001 | 0.7% | 2230 | 0.7% | 228 | 0.1% |
| Utility ROW (Forest) | 864 | 0.3% | 838 | 0.3% | -26 | 0.0% |
Change in Zone Land Cover, 1985-2010 |
||
 |
|
|
| Developed | ||
| Turf & Grass | ||
| Other Grass | ||
| Agricultural Field | ||
| Forest | ||
| Water | ||
| Wetland | ||
| Barren | ||
| 1985 | 2010 | Change | ||||
| acres | % | acres | % | acres | % | |
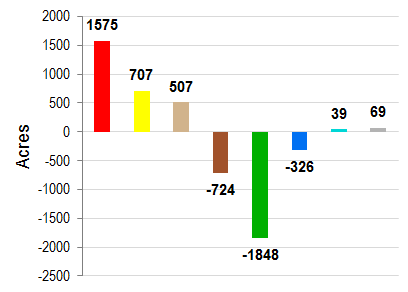
| Developed | 9194 | 12.6% | 10770 | 14.7% | 1575 | 2.2% |
| Turf & Grass | 3216 | 4.4% | 3924 | 5.4% | 707 | 1.0% |
| Other Grass | 845 | 1.2% | 1353 | 1.9% | 507 | 0.7% |
| Ag. Field | 4212 | 5.8% | 3489 | 4.8% | -724 | -1.0% |
| Deciduous Forest | 26977 | 36.9% | 25911 | 35.5% | -1065 | -1.5% |
| Coniferous Forest | 19597 | 26.8% | 19292 | 26.4% | -305 | -0.4% |
| Water | 2246 | 3.1% | 1920 | 2.6% | -326 | -0.4% |
| Non-forested Wetlands | 702 | 1.0% | 741 | 1.0% | 39 | 0.1% |
| Forested Wetlands | 5393 | 7.4% | 4917 | 6.7% | -476 | -0.7% |
| Tidal Wetlands | 0 | 0.0% | 0 | 0.0% | 0 | 0.0% |
| Barren | 505 | 0.7% | 575 | 0.8% | 69 | 0.1% |
| Utility ROW (Forest) | 153 | 0.2% | 152 | 0.2% | -2 | 0.0% |
Change in Riparian Zone Land Cover, 1985-2010 |
||
 |
|
|
| Developed | ||
| Turf & Grass | ||
| Other Grass | ||
| Agricultural Field | ||
| Forest | ||
| Water | ||
| Wetland | ||
| Barren | ||
| 1985 | 1990 | 1995 | 2002 | 2006 | 2010 | Change | |||||||
| acres | % | acres | % |
acres | % | acres | % | acres | % | acres | % | acres | % |
| 15276 | 2.3% | 16169 | 2.4% | 16469 | 2.4% | 16934 | 2.5% | 17283 | 2.6% | 17381 | 2.6% | 2105 | 0.3% |